


Feed aggregator
Do mild days fuel climate change scepticism?
When it comes to the weather, research suggests people often trust the evidence of their own eyes rather than expert opinion
Why do so many people remain sceptical about climate change when the evidence for it seems so obvious? One recent study may offer an interesting clue, because American scientists stood the argument on its head and looked at places across the globe that will probably enjoy more pleasant weather with climate change.
For Britain, northern Europe and North America there will be more days of mild weather, defined as 18 to 30C, with low humidity and little rain – the sort of weather which by most people’s accounts would be most agreeable. Parts of southern England, for example, will get an extra 10 to 15 days of mild weather a year by the end of this century. It’s not entirely good news, because the mild days will tend to come in spring and autumn, while the summers will grow hotter and more humid.
Continue reading...Labor's climate policy could remove the need for renewable energy targets
The federal Labor Party has sought to simplify its climate change policy. Any suggestion of expanding the Renewable Energy Target has been dropped. But there is debate over whether the new policy is actually any more straightforward as a result.
One thing Labor did confirm is its support for an emissions intensity scheme (EIS) as its central climate change policy for the electricity sector. This adds clarity to the position the party took to the 2016 election and could conceivably remove the need for a prescribed renewable energy target anyway.
An EIS effectively gives electricity generators a limit on how much carbon dioxide they can emit for each unit of electricity they produce. Power stations that exceed the baseline have to buy permits for the extra CO₂ they emit. Power stations with emissions intensities below the baseline create permits that they can sell.
An EIS increases the cost of producing electricity from emissions-intensive sources such as coal generation, while reducing the relative cost of less polluting energy sources such as renewables. The theory is that this cost differential will help to drive a switch from high-emission to low-emission sources of electricity.
The pros and cons of an EIS, compared with other forms of carbon pricing, have been debated for years. But two things are clear.
First, an EIS with bipartisan support would provide the stable carbon policy that the electricity sector needs. The sector would be able to invest with more confidence, thus contributing to security of supply into the future.
Second, an EIS would limit the upward pressure on electricity prices, for the time being at least.
These reasons explain why there was a brief groundswell of bipartisan support for an EIS in 2016, until the Turnbull government explicitly ruled it out in December.
Moving targetsAnother consideration is whether, with the right policy, there will be any need for firm renewable energy targets. This may help to explain Labor’s decision to rule out enlarging the existing scheme or extending it beyond 2020.
If we had a clear policy to reduce emissions at lowest cost, whether in the form of an EIS or some other scheme, renewable energy would naturally increase to whatever level is most economically efficient under those policy settings. Whether this reaches 50% or any other level would be determined by the overall emissions-reduction target and the relative costs of various green energy technologies.
In this scenario, a separately mandated renewable energy target would be simply unnecessary and would probably just add costs with no extra environmental benefit. Note that this reasoning would apply to state-based renewable energy policies, which have become a political football amid South Australia’s recent tribulations over energy security.
An EIS is also “technology agnostic”: power companies would be free to pursue whatever technology makes the most economic sense to them. Prime Minister Malcolm Turnbull explicitly endorsed this idea earlier this month.
Finally, an EIS would integrate well with the National Electricity Market, a priority endorsed by the COAG Energy Council of federal, state and territory energy ministers. State and territory governments may find this an attractive, nationally consistent alternative that they could support.
Strengths and weaknessesA 2016 Grattan Institute report found that an EIS could be a practical step on a pathway from the current policy mess towards a credible energy policy. Yet an EIS has its weaknesses, and some of Labor’s reported claims for such a scheme will be tested.
In the short term, electricity prices would indeed rise, although not as much as under a cap-and-trade carbon scheme. It is naive to expect that any emissions-reduction target (either the Coalition’s 26-28% or Labor’s 45%) can be met without higher electricity costs.
Another difficulty Labor will have to confront is that setting the initial emission intensity baseline and future reductions would be tricky. The verdict of the Finkel Review, which is assessing the security of the national electricity market under climate change policies, will also be crucial.
Despite media reports to the contrary, Chief Scientist Alan Finkel and his panel have not recommended an EIS. Their preliminary report drew on earlier reports noting the advantages of an EIS over an extended renewable energy target or regulated closure of fossil-fuelled power stations, but also the fact that cap-and-trade would be cheaper to implement.
Labor has this week moved towards a credible climate change policy, although it still has work to do and its 45% emissions-reduction target will still be criticised as too ambitious. Meanwhile, we’re unlikely to know the Coalition government’s full policy until after it completes the 2017 Climate Change Policy Review and receives the Finkel Review’s final report.
Australians can only hope that we are starting to see the beginnings of the common policy ground that investors and electricity consumers alike so urgently need.
Tony Wood holds shares in energy and resources companies through his superannuation fund.
A world safe for robots and mammoths | Letters
Can it be right to bring back the mammoth (Report, 17 February)? It disappeared at the beginning of this man-made age of extinction. For it to be returned towards its end, with declining populations of elephants and rhinos, is irony itself. It also highlights that technology is now so poorly controlled that the march of scientific ability will continue to outpace its ethics. Is a world of super-intelligent robots and their woolly mammoth pets really the direction to be going in?
Dr Colin Bannon
Crapstone, Devon
• Fun though it might be to see a woolly mammoth in the 21st century, I question the mammoth function in combating global warming. George Church says: “They keep the tundra from thawing by punching through snow and allowing cold air to come in,” and “In the summer they knock down trees and help the grass grow.” Couldn’t a bloke in a JCB do that? And a lot more cheaply, I imagine.
Francis Blake
London
Scientists 'solve' the ketchup problem
Slippery bottle solves ketchup problem
Fish under threat from ocean oxygen depletion, finds study
Oxygen levels in oceans have fallen 2% in 50 years due to climate change, affecting marine habitat and large fish such as tuna and sharks
The depletion of oxygen in our oceans threatens future fish stocks and risks altering the habitat and behaviour of marine life, scientists have warned, after a new study found oceanic oxygen levels had fallen by 2% in 50 years.
The study, carried out at Geomar Helmholtz Centre for Ocean Research in Germany, was the most comprehensive of the subject to date. The fall in oxygen levels has been attributed to global warming and the authors warn that if it continues unchecked, the amount of oxygen lost could reach up to 7% by 2100. Very few marine organisms are able to adapt to low levels of oxygen.
Continue reading...Pipeline politics
Expect to see more emergencies like Oroville Dam in a hotter world | Dana Nuccitelli
Scientists predicted decades ago that climate change would add stress to water management systems like Oroville Dam
The evacuation of nearly 200,000 people near Oroville Dam is the kind of event that makes climate change personal. A co-worker of mine was forced out of his home for several days by the emergency evacuation, and another friend was visiting Lake Oroville and happened to leave 15 minutes before the evacuation order was issued.
Like many extreme events, the Oroville emergency is a combination of natural weather likely intensified by climate change. California regularly sees “atmospheric rivers” that deluge the state with rainfall, but in a hotter world, scientists anticipate that they’ll be amplified by an increase in the amount of water vapor in the atmosphere.
Continue reading...The anatomy of an energy crisis – a pictorial guide, Part 2
In the second in my series on the crisis besetting the National Electricity Market (NEM) in eastern Australia, I look at the tightening balance of supply and demand.
Australia’s NEM is witnessing an unprecedented rise in spot, or wholesale, prices as market conditions tighten in response to a range of factors.
 Volume weighted NEM spot prices by season form 2005 on. Note the extraordinary elevated spot prices for the summer of 2017.
As shown above, spot prices are typically highest in summer, due in large part to the way extreme heat waves stretch demand. The historical summer average across the NEM is around $50/MWhour. As recently as 2012, summer prices were as low as $30/MWhour. With only a few days to go in the 2017 summer, prices are averaging a staggering $120/MWhour on a volume-weighted basis. Many factors have played a role, including hot weather, and the drivers vary from state to state.
In South Australia, the high prices have been accompanied by a series of rolling black-outs culminating on 8th February. Spot prices are more than twice last summer, on a volume-weighted basis, and three times the summer before that. Volatility has increased markedly, as evidenced by the way the volume-weighted price has diverged from the averaged spot price.
 Average spot prices (RRP) , and volume-weighted prices (VWP) for the Summer quarter in South Australia since 2000. The VWP’s, shown in the lighter shades, are higher than the RRP’s, because periods of high spot price generally correlated with increased volumes associated with high demand events. The difference in the VWP and RRP is a measure of the price volatility, which has increased from negligible in the summer of 2012 to significant in the summer of 2017. Note for 2017, the data extend only up to February 18th, the time of writing. Note also that in the summers of 2013 and 2014, the carbon tax applied at the wholesale level. In tat period, the effective price for a coal generator like to Northern was reduced by around $20/MWhour relative the market prices.
But the price rises and security issues have not been restricted to South Australia, with Queensland and New South Wales experiencing steeper rises in percentage terms. Current Queensland volume-weighted prices are averaging $200/MWhour, some 300% above the long-term summer average.
 Average spot prices (RRP), and volume-weighted prices (VWP) in lighter shades, for the summer quarter in Queensland since 2000.
On the 12th February new demand records were set in Queensland, with prices averaging $700/MWhour across the day. New South Wales narrowly averted load shedding on 10th February as temperatures and spot prices soared. So far, the exception has been Victoria, where summer prices have remain relatively subdued, at levels not far above the recent average.
 Average spot prices (RRP), and volume weighted prices (VWP) for the summer quarter in the four mainland regions in the NEM from 2012 on.
Demand and temperature
Average spot prices (RRP), and volume weighted prices (VWP) for the summer quarter in the four mainland regions in the NEM from 2012 on.
Demand and temperature
Demand for electrical power varies over a range of time-scales, from daily, weekly to seasonal, as well as with longer-term economic trends.
A key determinant in how much power is needed on any given day is the maximum daily temperature. As shown below, the maximum daily demand marks out a characteristic boomerang shape when plotted against maximum daily temperature. The boomerang bottoms out at temperatures of around 25°C when air conditioning loads are at a minimum.
 Boomerang pattern of maximum daily demand in South Australia and maximum daily temperature in Adelaide, by financial year (FY13-14 through FY16-17). Data sourced from the Bureau of Meteorology and from AEMO. Days with average spot prices above $500/MWhour (or about 10 times the NEM average) are identified by larger dots and are encircled. Recent days of exceptional spots prices across the NEM are also highlighted. The figures discriminate between weekdays and weekend, and exclude the Christmas - New Year period, where demand deviates from normal because of low industrial, commercial and public sector loads.
As illustrated above, demand increases significantly in response to heating loads as the weather cools below 20°C and cooling loads as the weather warms above 30°C. The difference in demand across the weather cycles can be substantial. For example, in South Australia the maximum daily demand varies from around 1500 megawatts on a day with a maximum temperature of 25°C to around 3000 megawatts during heatwaves when the temperatures exceed 40°C. With minimum daily loads under 1000 megawatts, This implies well over half the generation capacity in South Australia is needed to meeting peak demand in extreme days, with much of it sitting idle waiting for extreme hot weather events. To recoup costs in an energy-only market like the NEM, such peaking capacity demand extreme pricing accompany its dispatch. In reality to manage risks, such capacity is normally hedged at a cap-contract of around $300/MWhour
Similar patterns apply in other states, although in percentage terms the range is less severe. In Queensland the increase between 25 and 40 degree days is about 2000 megawatts or approx 30%.
 Boomerang pattern of maximum daily demand in Queensland and maximum daily temperature in Brisbane, by financial year (FY13-14 through FY16-17). Note the extreme conditions on Sunday 12th February.
A comparison of the figures above show some subtle but important differences in the South Australia and Queensland markets. Notably, the diagrams show that annual demand in Queensland has been rising progressively over the last four years, while it has been static in South Australia. The extreme weather of Sunday 12th February set a new demand record in Queensland, and well above any previous weekend day. In contrast, the 8th February peak in South Australia was lower than previous peaks. To understand why spot prices spiked to similar levels in the different regions requires a deeper dive into the local market conditions.
South Australian market dynamicsOne reason for seasonal variability in prices is the natural variability in weather conditions, and particularly the frequency and intensity of heat waves. As illustrated below, the 2017 summer in Adelaide has been rather normal in terms of weather extremes, so far with only six days above 40°C compared to seven last summer and thirteen in the 2014 summer. To date, the mean maximum is around 29.7°C , more-or-less spot on the average over the last five years. As such weather variability would not seem to be the key factor driving the recent dramatic rise in spot prices.
 Proportional distribution of daily maximum temperatures in Adelaide (Kent Town) for the summer quarter, coloured by year. Data sourced from the Bureau of Meterology.
The most significant change in the South Australian market last year was the closure in May of its last coal fired-power plant - Alinta’s 520 megawatt capacity Northern Power Station. Along with questions about long-term coal supply, Alinta’s decision to close had a lot to do with the low spot prices back in 2015.
Back then, spot prices were suppressed on the back of a fall in both domestic and industrial demand as well as the addition of new wind farms into the supply mix. As shown below, the rapid uptake of solar PV in South Australia had impacted the demand for grid based services, especially during summer, limiting price volatility, and affecting generator revenue streams via a lowering of forward contract prices. In combination, the conditions made for a significant excess in generating capacity, or capacity overhang.
 The plot of averaged demand by time of day, for the summer quarter, helps illustrate the way the uptake of domestic solar PV has impacted demand for grid base electricity, reducing midday demand by ~ 30% (~500 megawatts) on average. Note that as shown below, the demand of peak days is much higher, approaching 3000 megawatts.
Despite the falling average demand, and a changing load distribution, the peak demand during the recent heat wave reached above 3045 megawatts in the early evening of 8th February (at 6 pm Eastern Australian Standard Time). That was 340 megawatts lower than the all time South Australian peak of 3385 megawatts for South Australia on the 31st January 2011. The peak on February 8th was accompanied by a spot price of $13160/MWhour.
 As for above, but also showing the demand profile for the extreme day of 8 February, 2017 (black dashed line), when South Australia suffered rolling black outs due to load shedding, and the all time high (red dashed line).
With the closure of Northern, any comparison with previous peak demand events should factor in any demand previously served by Northern Power Station. Before its closure Northern contributed around 420 megawatts power on average over the summer months. Without that supply available this year, the February 8th peak effectively exceeded the previous peak by around 80 megawatts in adjusted terms.
 Relative or adjusted peak demand records for South Australia, accounting for the load served by Northern Power Station prior to its closure prior to May 2016.
Queensland market dynamics
Relative or adjusted peak demand records for South Australia, accounting for the load served by Northern Power Station prior to its closure prior to May 2016.
Queensland market dynamics
Queensland has experienced a hot summer with the maximum daily temperature in Brisbane reaching 37°C for the first time since 2014 years, and an average daily maximum of 31.2°C (at the time of writing). That is about one degree above the average of recent years. However, with only four days with a maximum temperature above 35°C, compared to five in the summer of 2015, weather effects seem unlikely to fully account for the extraordinary rise in spot prices this summer.
 Proportional distribution of daily maximum temperatures in Brisbane for the summer quarter, coloured by year. Data sourced from the Bureau of Meteorology.
In detail the Queensland market differs from other regions in the NEM in as much as it is the only region to have experienced significant demand growth in recent years. Mapping the change of demand growth over the years, by time of day, helps reveal the drivers for market tightening, as shown below firstly in absolute terms, and then in relative terms normalised against 2014.
 Queensland demand loads in megawatts by time of day for the summer quarter, for select years from 2010 to 2017.
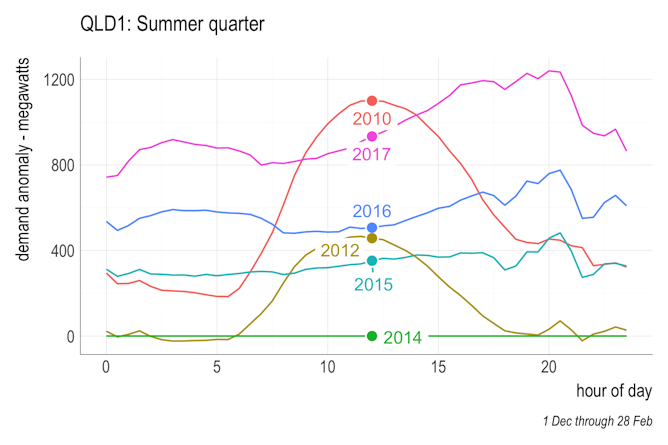 Queensland demand anomalies in megawatts by time of day for the summer quarter, normalised against the summer quarter of 2014.
Between 2009 and 2014, summer demand fell by about 400 megawatts (or 6%), with the greatest change occurring in the middle of day. This pattern is akin to the signal in South Australia shown above, and reflects how the growing deployment of domestic rooftop PV was revealed to the market as a demand reduction.
Since, 2014 demand has grown appreciably across all times of day, skewed somewhat towards the evening. Relative to 2014, demand is up by almost 800 megawatts across the board, and by as much as 1200 megawatts at 9 pm. The 800 megawatt base shift in demand can be attributed in large part to new industrial loads associated with the commissioning of the LNG export gas processing facilities at Curtis Island.
In terms of extreme events, it is notable that February 12th this year set a new Queensland demand record at 5.30 pm of 9368 megawatts (at the half hour settlement period) with a spot price of $9005. This is extraordinary given it was a Sunday, a day which normally sees demand down several percentage points, on corresponding weekdays with similar temperature conditions.
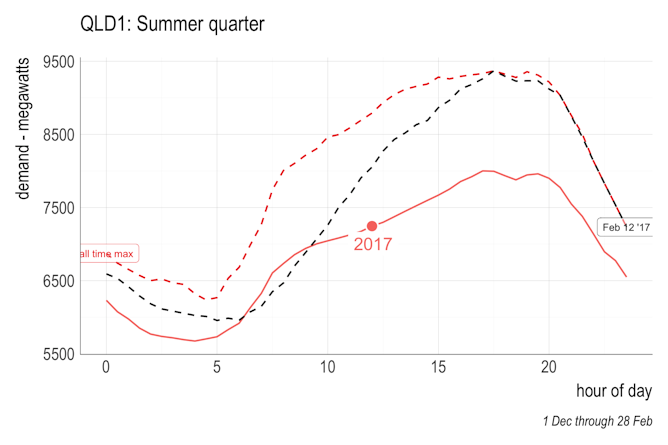 Peak demand characteristics in Queensland highlighting the events of February 12th, when a new peak demand record was set at the 5.30 pm half hour settlement period.
What’s different about Victoria?
Peak demand characteristics in Queensland highlighting the events of February 12th, when a new peak demand record was set at the 5.30 pm half hour settlement period.
What’s different about Victoria?
Victoria is the exception to the trend of rising spot prices, with the summer prices of 2017 not much above long term average. In part, the relatively subdued prices can be attributed to the absence of extreme heat in southern Victoria so far this summer. The mean maximum daily summer temperature in Melbourne stands at about 27°C, slightly below average of the previous five years. So far there have been no days with temperatures above 40°C, compared to eight in 2014 and four in 2016.
 Proportional distribution of daily maximum temperatures at Melbourne Airport for the summer quarter, coloured by year. Data sourced from the Bureau of Meteorology.
The dominant factor in subduing the Victorian markets prices is likely to be the ongoing fall in demand. In the year to 18th February, demand in Victoria fell by 200 MW. This follows a persistent reduction in demand that has seen a fall of almost 500 megawatts over the last three years, equivalent to 9% of average demand. As shown below, the contrast with Queensland is stark, and reflects significant reductions in industrial demand stemming from the closure of the Point Henry aluminium smelter in August 2014 (Point Henry consumed up to 360 megawatts) and more recently the reduced demand from the Portland smelter on the back of damage caused by an unscheduled power outage on December 1st, 2016. While power capacity in Victoria was reduced by the closure of the 150 megawatt Anglesea coal-fired power plant in August 2015, the cumulative demand reduction over the last decade has led to substantial capacity overhang. All that is set to change with the closure of the 1600 Megawatt Hazelwood power station, slated for the end of March.
 Average demand for the year ending February 18th for Victoria coloured in blue and Queensland coloured in maroon. demand.
Some emerging issues
Average demand for the year ending February 18th for Victoria coloured in blue and Queensland coloured in maroon. demand.
Some emerging issues
The figures shown in the previous sections reveal that peak demand events are stretching the power capacity of the NEM in unprecedented ways, for a variety of reasons. The tightening in the demand-supply balance is driving steep price rises that, if sustained, will have widespread repercussions. For example, a $20/MWhour rise in the Queensland spot price translates to a notional annual market value of $1 billion, that must eventually flow through the contract markets. With summer prices already more than $100/MWhour above last year, the additional costs to be passed onto energy consumers may well tally in the many billions of dollars.
In South Australia, the market tightening follows substantially the reduced supply stemming from the closure of the Northern Power Station.
In Queensland, the market tightening is being driven substantially by industrial loads such as the new LNG gas processing facilities. To the extent that the LNG industry is a significant driver, it is a heavy excise to pay for the privilege of exporting our gas resource. The makings for a policy nightmare, should the royalties from our LNG export be outweighed by the cumulative cost impacts passed on via our electricity markets.
It is important to note that the electricity market is designed so that prices fluctuate significantly in response to the normal capacity cycle, as capacity is added to or removed from the market following rises and falls in demand. In small markets, such as South Australia, the spot price fluctuations over the capacity cycle can be extreme, because the capacity of an individual large power plants can represent a large proportion of the native demand.
Although not large in terms of total capacity by Australian standards, Northern’s 520 megawatt power rating represented around 40% of the South Australia’s median demand. That made Northern one of the Australia’s most significant power stations in terms of its regional basis size. Its withdrawal has dramatically and abruptly reduced the capacity overhang in South Australia. Spot prices were always going to rise as a consequence, because that is the way the market was designed. In addition, Northern’s closure has also increased South Australia’s reliance on gas generation, and it has concentrated market power in the hands of remaining generators, both of which have had additional price impacts beyond the normal market tightening.
In both Queensland and South Australia, the rises in spot prices is signalling the growing tightness in the market. Under normal circumstances would serve to drive investment in new capacity. The lessons of Northern show that any new capacity in South Australia will need to be responsive to the changing pattern of demand, unless the makers rules are changed.
Further, both regions have questions about the adequacy of competition. Both are subject to the impacts of parallel developments in the gas markets, which have made gas production much more expensive. In the case of Queensland this is greatly exacerbated by the extra demand from the LNG gas production facilities.
Finally, these insights have importance for predicting how the markets the will react to the impending close of the 1600 megawatt Hazelwood Power Station in Victoria, all topics I hope to consider in following posts in this series.
Mike Sandiford receives funding from the Australian Research Council and ANLECR&D (Australian National Low Emissions Coal Research & Development).
Federal Politics: Clean coal and Anna Bligh's new job
The challenge of getting arsenic out of drinking water
The looming energy catastrophe
Angus Taylor: Investing in clean coal, and housing affordability
Close encounter with a hare – a rare sight in the West Country
West Dartmoor To have chanced across this night-roamer, lolloping calmly across the muddy lane, was a rare privilege indeed.
Hemmed in on either side by tall hedgerows, this narrow Dartmoor lane skirts the flank of higher ground and scores a deep furrow between fields so that after dark you feel you are tunnelling through the terrain, headlights tracing a leaden seam of asphalt. There is little traffic here to trouble nocturnal wildlife. Over the years I have come across badgers, heads striped like road markings, furtive-looking foxes and occasionally a barn owl, achingly white in the full beams.
This winter’s night, an unexpected wanderer took shape among the blanched fishbone stems of dead weeds, as if created by the action of light on darkness. Long ears held high, hindquarters arched over rangy rear legs, large eyes that brought me to a halt. A hare!
Continue reading...