


The Conversation
Explainer: how does the sea 'disappear' when a hurricane passes by?
You may have seen the media images of bays and coastlines along Hurricane Irma’s track, in which the ocean has eerily “disappeared”, leaving locals amazed and wildlife stranded. What exactly was happening?
These coastlines were experiencing a “negative storm surge” – one in which the storm pushes water away from the land, rather than towards it.
Read more: Irma and Harvey: very different storms, but both affected by climate change
Most people are familiar with the idea that the sea is not at the same level everywhere at the same time. It is an uneven surface, pulled around by gravity, such as the tidal effects of the Moon and Sun. This is why we see tides rise and fall at any given location.
At the same time, Earth’s atmosphere has regions where the air pressure is higher or lower than average, in ever-shifting patterns as weather systems move around. Areas of high atmospheric pressure actually push down on the ocean surface, lowering sea level, while low pressure allows the sea to rise slightly.
This is known as the “inverse barometer effect”. Roughly speaking, a 1 hectopascal change in atmospheric pressure (the global average pressure is 1,010hPa) causes the sea level to move by 1cm.
When a low-pressure system forms over warm tropical oceans under the right conditions, it can intensify to become a tropical depression, then a tropical storm, and ultimately a tropical cyclone – known as a hurricane in the North Atlantic or a typhoon in the northwest Pacific.
As this process unfolds, the atmospheric pressure drops ever lower and wind strength increases, because the pressure difference with surrounding areas causes more air to flow towards the storm.
In the northern hemisphere tropical cyclones rotate anticlockwise and officially become hurricanes once they reach a maximum sustained wind speed of around 120km per hour. If sustained wind speeds reach 178km per hour the storm is classed as a major hurricane.
Surging watersA “normal” storm surge happens when a tropical cyclone reaches shallow coastal waters. In places where the wind is blowing onshore, water is pushed up against the land. At the same time the cyclone’s incredibly low air pressure allows the water to rise higher than normal. On top of all this, the high waves whipped up by the wind mean that even more water inundates the coast.
The anticlockwise rotation of Atlantic hurricanes means that the storm’s northern side produces winds blowing from the east, and its southern side brings westerly winds. In the case of Hurricane Irma, which tracked almost directly up the Florida panhandle, this meant that as it approached, the east coast of the Florida peninsula experienced easterly onshore winds and suffered a storm surge that caused severe inundation and flooding in areas such as Miami.
The negative surgeIn contrast, these same easterly winds had the opposite effect on Florida’s west coast (the Gulf Coast), where water was pushed offshore, leading to a negative storm surge. This was most pronounced in areas such as Fort Myers and Tampa Bay, which normally has a relatively low tide range of less than 1m.
The negative surge developed over a period of about 12 hours and resulted in a water level up to 1.5m below the predicted low tide level. Combined with the fact that the sea is shallow in these areas anyway, it looked as if the sea had simply disappeared.
Read more: Predicting disaster: better hurricane forecasts buy vital time for residents.
As tropical cyclones rapidly lose energy when moving over land, the unusually low water level was expected to rapidly rise, which prompted authorities to issue a flash flood warning to alert onlookers to the potential danger. The negative surge was replaced by a storm surge of a similar magnitude within about 6 hours at Fort Myers and 12 hours later at Tampa Bay.
Rising waters are the deadliest aspect of hurricanes – even more than the ferocious winds. So while it may be tempting to explore the uncovered seabed, it’s certainly not wise to be there when the sea comes rushing back.
Darrell Strauss receives funding from an Advance Queensland Research Fellowship in partnership with Griffith University and the City of Gold Coast.
How Antarctic ice melt can be a tipping point for the whole planet's climate
 Melting Antarctic ice can trigger effects on the other side of the globe. NASA/Jane Peterson
Melting of Antarctica’s ice can trigger rapid warming on the other side of the planet, according to our new research which details how just such an abrupt climate event happened 30,000 years ago, in which the North Atlantic region warmed dramatically.
This idea of “tipping points” in Earth’s system has had something of a bad rap ever since the 2004 blockbuster The Day After Tomorrow purportedly showed how melting polar ice can trigger all manner of global changes.
But while the movie certainly exaggerated the speed and severity of abrupt climate change, we do know that many natural systems are vulnerable to being pushed into different modes of operation. The melting of Greenland’s ice sheet, the retreat of Arctic summer sea ice, and the collapse of the global ocean circulation are all examples of potential vulnerability in a future, warmer world.
Read more: Chasing ice: how ice cores shape our understanding of ancient climate.
Of course it is notoriously hard to predict when and where elements of Earth’s system will abruptly tip into a different state. A key limitation is that historical climate records are often too short to test the skill of our computer models used to predict future environmental change, hampering our ability to plan for potential abrupt changes.
Fortunately, however, nature preserves a wealth of evidence in the landscape that allows us to understand how longer time-scale shifts can happen.
Core valuesOne of the most important sources of information on past climate tipping points are the kilometre-long cores of ice drilled from the Greenland and Antarctic ice sheets, which preserve exquisitely detailed information stretching back up to 800,000 years.
The Greenland ice cores record massive, millennial-scale swings in temperature that have occurred across the North Atlantic region over the past 90,000 years. The scale of these swings is staggering: in some cases temperatures rose by 16℃ in just a few decades or even years.
Twenty-five of these major so-called Dansgaard–Oeschger (D-O) warming events have been identified. These abrupt swings in temperature happened too quickly to have been caused by Earth’s slowly changing orbit around the Sun. Fascinatingly, when ice cores from Antarctica are compared with those from Greenland, we see a “seesaw” relationship: when it warms in the north, the south cools, and vice versa.
Attempts to explain the cause of this bipolar seesaw have traditionally focused on the North Atlantic region, and include melting ice sheets, changes in ocean circulation or wind patterns.
But as our new research shows, these might not be the only cause of D-O events.
Our new paper, published today in Nature Communications, suggests that another mechanism, with its origins in Antarctica, has also contributed to these rapid seesaws in global temperature.
Tree of knowledge The 30,000-year-old key to climate secrets.
Chris Turney, Author provided
The 30,000-year-old key to climate secrets.
Chris Turney, Author provided
We know that there have been major collapses of the Antarctic ice sheet in the past, raising the possibility that these may have tipped one or more parts of the Earth system into a different state. To investigate this idea, we analysed an ancient New Zealand kauri tree that was extracted from a peat swamp near Dargaville, Northland, and which lived between 29,000 and 31,000 years ago.
Through accurate dating, we know that this tree lived through a short D-O event, during which (as explained above) temperatures in the Northern Hemisphere would have risen. Importantly, the unique pattern of atmospheric radioactive carbon (or carbon-14) found in the tree rings allowed us to identify similar changes preserved in climate records from ocean and ice cores (the latter using beryllium-10, an isotope formed by similar processes to carbon-14). This tree thus allows us to compare directly what the climate was doing during a D-O event beyond the polar regions, providing a global picture.
The extraordinary thing we discovered is that the warm D-O event coincided with a 400-year period of surface cooling in the south and a major retreat of Antarctic ice.
When we searched through other climate records for more information about what was happening at the time, we found no evidence of a change in ocean circulation. Instead we found a collapse in the rain-bearing Pacific trade winds over tropical northeast Australia that was coincident with the 400-year southern cooling.
Read more: Two centuries of continuous volcanic eruption may have triggered the end of the ice age.
To explore how melting Antarctic ice might cause such dramatic change in the global climate, we used a climate model to simulate the release of large volumes of freshwater into the Southern Ocean. The model simulations all showed the same response, in agreement with our climate reconstructions: regardless of the amount of freshwater released into the Southern Ocean, the surface waters of the tropical Pacific nevertheless warmed, causing changes to wind patterns that in turn triggered the North Atlantic to warm too.
Future work is now focusing on what caused the Antarctic ice sheets to retreat so dramatically. Regardless of how it happened, it looks like melting ice in the south can drive abrupt global change, something of which we should be aware in a future warmer world.
Chris Turney receives funding from the Australian Research Council.
Jonathan Palmer receives funding from the Australian Research Council (ARC).
Peter Kershaw has received fundng from the Australian Research Council.
Steven Phipps receives funding from the Australian Antarctic Science Program, the Australian Research Council, the International Union for Quaternary Research, the National Computational Infrastructure Merit Allocation Scheme, the New Zealand Marsden Fund, the University of Tasmania and UNSW Australia.
Zoe Thomas receives funding from the Australian Research Council.
Politics podcast: Mark Butler on energy uncertainty
 David Mariuz/AAP
Pressure is mounting on the government to put an end to energy uncertainty as an Australian Energy Market Operator (AEMO) report warns of looming power shortages over the next few years.
Opposition climate change and energy spokesman Mark Butler has written about the toxic divisions on energy policy in his recent book, Climate Wars. He recognises there are challenges in the Coalition partyroom over the Finkel report, but says Labor will negotiate with the government on an energy framework. It wants to avoid an ALP government inheriting the policy chaos.
Responding to the government’s push to extend the life of the Liddell power station, he says Malcolm Turnbull has unfairly concluded there is only one option.
“With a proper investment framework in place, new investment that will last decades, not just a few more years … could take place. At the moment we have an investment strike and if we can’t end the investment strike then yes in five years time in NSW we will be in a position of supply shortage.”
On the future of coal, Butler says it’s still “a massive part of our system”, and while usage will go down over time, it will be a part of the system for “as far as we politically can see”.
“The problem is not old coal power plants closing, it’s that nothing is being put in to replace them.”
On alternative sources like battery power he is optimistic about their potential, while sceptical of expanding hydro power until the results of a feasibility study are produced.
Michelle Grattan does not work for, consult, own shares in or receive funding from any company or organisation that would benefit from this article, and has disclosed no relevant affiliations beyond the academic appointment above.
How the sky can help make air conditioners at least 20% more efficient
 Could the new invention spell the end of rooftop fans? Christophe Finot/Wikimedia Commons, CC BY-SA
Specially designed fluid-filled roof panels can help make air conditioning significantly more efficient, according to new research.
These panels work like solar water heaters, except that they extract heat from the flowing fluid, rather than adding it. This has only been made possible through the development of new, highly reflective materials that allow more heat to be taken out of the fluid than finds its way back in, even in the heat of a sunny day.
Read more: How to keep your house cool in a heatwave.
As a result, the researchers, led by Eli Goldstein of Stanford University, calculate that these panels, when integrated into an existing air conditioning system, can use 20-50% less power to deliver the same amount of indoor cooling. This in turn could help smooth out demand peaks on the electricity grid in summer, cut energy bills, and reduce the risk of blackouts.
Cool researchFor several years, the Stanford researchers and my own group at UTS in Sydney have been trying to design smart roof materials that will help dissipate heat from air conditioning systems more effectively.
Conventional air-conditioning systems get rid of their heat by simply venting hot air from the system’s outdoor fan unit. But the new design adds an extra step, using a heat exchanger to pass the normal refrigerant heat into the fluid, which can be either water or glycol. This fluid then flows into the rooftop cooling panels so the heat can be dissipated into the sky.
 The old system and the new.
Goldstein et al. Nature Energy
The old system and the new.
Goldstein et al. Nature Energy
The previous problem with this approach was that on hot, sunny days – when you need air conditioning the most – the Sun makes the fluid-filled panels heat up, rather than cool down.
This problem has only been solved in the past three years, with the design of super-reflective surfaces that can repel 97% of the incoming solar energy.
Feeling the heatNearly all synthetic and natural surfaces absorb at least 5% of incident solar heat. Even the best white roof paints typically absorb more than 10% of the Sun’s heat. The best-performing surface is a shiny, flawless layer of silver, but that doesn’t last very long in outdoor conditions.
But what if we can protect the silver, and maybe even improve its reflective performance by placing it under a layer that also helps to reflect solar energy? Three research groups came up with possible solutions, two involving plastic coverings for the silver, and the third involving a complex layering of different oxide materials.
At UTS, our approach involved using many layers of two different plastics, placed on top of the silver. The resulting material reflects 97% of the incident solar energy, repelling the sun’s heat so effectively that the fluid inside cools down, even on a hot day.
Look to the skiesAs the new Stanford research confirms, these super-reflective surfaces can perform a neat trick: getting the rooftop to lose heat during the day in the same way it does on a clear night. On clear nights, upward-facing surfaces can drop to several degrees below the ambient temperature because their heat dissipates high into the sky. The new super-cool roof panels do the same in the daytime as well. For example, they can condense dew well after sunrise even though the outdoor air temperature is above the dew point.
Read more: Air conditioning: we need to talk about indoor climate change.
The panels can easily be retrofitted onto existing air-conditioning systems, ultimately saving money in the long run because of the reduced energy use. By modelling their system’s performance, the Stanford researchers calculate that the panels could reduce air-conditioning costs by 21% for a typical two-storey building in the sunny climate of Las Vegas.
These kind of hybrid systems could become commonplace, combining existing indoor air-conditioning technology with the new panels shedding the heat directly upwards into the sky. If you’ll pardon the pun, things are really looking up for those aiming to bring their energy bills down.
Geoff Smith receives funding from Australian Research Council.
Drones help scientists check the health of Antarctic mosses, revealing climate change clues
 Mosses are sensitive to even minor changes in their living conditions. Sharon Robinson, Author provided
Drones are helping scientists check the health of Antarctic mosses, revealing clues on the pace of climate change.
The scientists say their method could be used for similar research in other harsh environments like desert or alpine regions.Mosses are sensitive to even minor changes in their living conditions, and scientists traditionally tramped through difficult terrain to collect data on them.
Using the specially-designed drones is faster, kinder to the environment and delivers detailed images that satellite imagery cannot match.
Drones also allow to map much larger areas than previously possible, showing how the moss health responds to meltwater in real time.
These methods could be used for similar research in other harsh environments like desert or alpine regions.
Zbyněk Malenovský has received grants from the ARC and Australian Antarctic Science. He is affiliated with the Surveying and Spatial Sciences Group at the University of Tasmania, the Centre for Sustainable Ecosystem Solutions at the University of Wollongong and the Global Change Research Institute at the Czech Academy of Sciences.
Arko Lucieer has received grants from the Australian Research Council and Australian Antarctic Science Grant Scheme.
Irma and Harvey: very different storms, but both affected by climate change
There has been no let up since Hurricane Harvey dumped record-breaking rains on the Houston area of Texas. Hurricane Irma lashed parts of the Caribbean and Cuba and is now heading onto the US mainland, having devastated the Florida Keys and the state’s west coast.
We also have Hurricane Jose following Irma through the Caribbean, and Hurricane Katia, now downgraded after tracking through parts of eastern Mexico.
Read more: Are catastrophic disasters striking more often?
This very active season comes after a “hurricane drought” with very few major storms making landfall on the US coast over the previous decade.
So why are we seeing so many hurricanes now? Is climate change to blame?
How to make a hurricaneThere are several vital ingredients needed for hurricanes to form. These include an initial disturbance in the atmosphere for the storm to form around, very warm sea surface temperatures to sustain the storm, and a lack of vertical wind shear so the storm is not torn apart during its formation.
In the Atlantic Ocean, hurricanes often form near Cape Verde off the coast of West Africa. They then track westward towards the Caribbean and the US.
Lots of factors can affect how strong these storms ultimately become, including how much time they spend gathering strength over the ocean, and the background weather patterns through which they travel.
 Sea surface temperatures are well above normal over the tropical Atlantic. The effects of Hurricane Harvey mixing up cooler waters off the Texan coast can be seen.
NOAA Office of Satellite and Product Operations
Sea surface temperatures are well above normal over the tropical Atlantic. The effects of Hurricane Harvey mixing up cooler waters off the Texan coast can be seen.
NOAA Office of Satellite and Product Operations
This storm season we have seen sea temperatures persistently 1-2℃ above normal over the tropical Atlantic Ocean, which has allowed stronger storms to form and develop.
Atlantic sea temperatures have warmed over the past century, thus enhancing one of the key ingredients for hurricane formation. The climate change influence is clear for the sea temperatures, but not so much for the other ingredients required in forming hurricanes.
Harvey and IrmaWhile we have low confidence in the effect of human-caused climate change on hurricane formation, it is clear that climate change is enhancing some of the impacts of these storms.
Hurricane Harvey hit southern Texas hard by stalling over the Houston area and dumping huge amounts of rain. Climate change might have contributed to the stalling effect, but what’s clearer is that climate change is making intense extreme rainfall events like we saw over Houston more likely. By warming the atmosphere we’re also increasing its capacity to carry moisture.
When we have the trigger for heavy rainfall, climate change makes it rain harder.
Hurricane Irma is a very different beast to Harvey. It devastated several Caribbean islands including Anguilla and the Virgin Islands when it was a Category 5 system. It then struck Cuba before re-intensifying and moving north across the Florida Keys and onto the US mainland.
Irma’s main impacts have been through the storm surge, the strong winds and the heavy rains.
Climate change has likely worsened the effects of Irma. As described above, we know that climate change is intensifying extreme rain events. We also know that climate change is worsening storm surges by raising the background sea level on which these events occur.
Sea levels are projected to rise further over the coming century, by 50-100cm under a high greenhouse gas emissions scenario, and 20-50cm if we greatly reduce our emissions.
So while it’s likely that climate change is contributing to more extreme hurricanes, we have even more confidence that climate change is worsening the impacts of these storms, and will continue to do so over the coming decades.
Paving over the Gulf CoastBesides the climate change influence, the widespread urban development on the US Gulf Coast is exacerbating the impacts of hurricanes.
Much like the Houston area, Florida also has a growing population. This means that not only are there more people in harm’s way when a major hurricane strikes, but there is also more concrete and other impervious surfaces that allow the water to pool in low-lying areas.
Is there any good news?While climate change and development in hurricane-prone areas are worsening the impacts of these hurricanes, there are some glimmers of good news.
Scientists’ ability to track and forecast these major systems has improved greatly. Better forecasting of hurricanes allows for earlier planning for their impacts and should improve evacuation processes.
In theory, with the right plans in place, better hurricane forecasting should reduce death tolls from events like Irma. But it doesn’t necessarily reduce the economic costs of these storms, and for both Harvey and Irma the clean-up and recovery bills will be more than A$100 billion each.
It’s clear that climate has worsened the impacts of Atlantic hurricanes and will continue to do so. Improved forecasting provides a glimmer of hope that the death tolls from future events can be reduced, even as the economic impacts increase.
Andrew King receives funding from the ARC Centre of Excellence for Climate System Science.
Fake news and god's wrath: extreme hurricane politics in the US
 Hurricanes, like Irma which has just hit Florida, command more attention because they have a strong visual identity and are often given human names and attributes. Reuters/Carlos Barria
The devastating scenes of destruction and flooding in the Bahamas and the southern states of the US have captivated the world for many weeks now. Hurricanes Harvey and Irma, and Hurricane Jose soon to follow, have stolen headlines around the world, as they break records and provide a deluge of spectacle and image … the main ingredients for tabloid reporting.
Of course, as far as the fatalities they have caused, which are now into the hundreds, they have not been as dangerous as the under-reported monsoons that devastated India, Nepal and Bangladesh a few weeks ago, with death tolls into the thousands. But, in the oligopolised world of the news wires of AFP, Reuters and AP, threats to developed nations push well ahead of tragedy in the third world, an imperialist bias that reflects the global hierarchy of nation states as defined by news services.
But is also true that hurricanes (typhoons and cyclones) command more attention because they have a strong visual identity. Unlike monsoonal rains, they are also endowed with a personality.
For a start, each hurricane is given a name, and often they are referred to as “monsters” that have some kind of personality. “Irma is unpredictable, ferocious, powerful”, and so on. Unlike monsoons, hurricanes are to be feared, almost like they are preying on humans.
But in the US, these same hurricanes have been the subject of ridicule and religious divinity.
In between all of the suffering in Texas and now in Florida, conservative radio talk show host Rush Limbaugh, who broadcasts out of Palm Beach, Florida, had labelled Hurricane Irma a kind of fake news. Limbaugh, a strident Trump supporter, has sought to persuade his listeners that these Hurricanes are wildly exaggerated, potentially endangering those who may not take seriously the official emergency weather warning. He said:
There is a desire to advance this climate change agenda, and hurricanes are one of the fastest and best ways to do it … All you need is to create the fear and panic accompanied by talk that climate change is causing hurricanes to become more frequent and bigger and more dangerous, and you create the panic, and it’s mission accomplished, agenda advanced.
Limbaugh claims that hurricanes bring together three unlikely beneficiaries: climate change activists, television broadcasters and retailers, the latter two having a “symbiotic relationship”.
For Limbaugh, TV stations, which receive much advertising revenue from retailers, become fixated with the hurricane, causing panic and mass raids on retail supplies of food, water, batteries and fuel. For the radio shock jock, this creates a vicious circle of interests more important than the hurricane itself.
Of course, Limbaugh is at least partly right. Tabloid television is most at home in covering violent events, whether this is extreme weather, terrorism, or violent crime. The more images it has about these events, the more it will cover them.
However, that these same broadcasters will make any significant link to climate change has not been a trend in either the US or Australia. It may increase audience concern about climate change, but not really their understanding that the more energy you have in the oceans, the more potential there is for powerful storms. Extreme weather is indeed the best time to communicate climate change, but it has to be done in a way that increases audience understanding of the causes, impacts and projections for the future.
It also has to be done in a way that demonstrates what is so different about today’s extreme weather. With Hurricane Irma, for example, what has amazed climatologists, is that it was one of a trio of hurricanes that were threatening land at the same time. Irma itself matched the force of Katrina in terrajoules of energy. Then there are the scenes of Irma literally sucking up the ocean around beaches and changing the shape of coastlines during that period. The forces involved are unprecedented in the modern record.
Yet, it seems that the more extreme the nature of the hurricanes, the more extreme are the reactions of climate denialists. And here we can point to the growing number of television evangelists who are also getting some attention out of the hurricane. Both Harvey and Irma have been hailed as biblical events that have wrought retribution on those who have not followed the path of god. Televangelist Jim Bakker and Pastor Rick Joyner observed last week that “storms don’t happen by accident”. The Houston flood was from God and if, according to Pastor Kevin Swanson, the supreme court would rule abortion and gay marriage to be illegal, Houston would have averted a disaster.
Conservative social commentator Anne Coulter, tweeted to her 1.7 million followers that Houston’s recent baptism was more likely to be payback for having elected a lesbian mayor in its recent past than it was related to climate change.
Doubtless, the fact that Hurricane Irma has spared the southern White House, Mar-a-Lago from a direct hit, will also be comfort to President Trump’s evangelist supporters. The luxurious resort is again in the news, but this time for not answering calls for Trump to open it as a shelter for displaced Hurricane victims.
Oh, and Rush Limbaugh fled from his home in Palm Beach, two days before Irma hit.
Drones and wildlife – working to co-exist
 Researchers have reviewed evidence for wildlife disturbance and current drone policies and found that the law is playing catch-up with emerging technology. Pip Wallace, CC BY-ND
The drone market is booming and it is changing the way we use airspace, with some unforeseen consequences.
The uptake of remotely piloted aircraft (RPAs) has been swift. But despite their obvious benefits, concerns are growing about impacts on wildlife.
In our research we investigate whether regulation is keeping pace with the speed of technological change. We argue that it doesn’t, and we suggest that threatened species might need extra protection to ensure they aren’t harmed by drones.
RPA managementDrones are useful tools for conservation biologists. They allow them to survey inaccessible terrain and assist with many challenging tasks, from seeding forests to collecting whale snot.
But researchers are also discovering that RPAs have negative impacts on wildlife, ranging from temporary disturbances to fatal collisions.
Disturbance from vehicles and other human activity are known to affect wildlife, but with the speed that drones have entered widespread use, their effects are only just starting to be studied.
So far, the regulatory response has focused squarely on risks to human health, safety and privacy, with wildlife impacts only rarely taken into account, and even then usually in a limited way.
Read more: The age of drones has arrived quicker than the laws that govern them
It is not uncommon for regulatory gaps to arise when new technology is introduced. The rapid growth of drone technology raises a series of questions for environmental law and management.
We have reviewed evidence for wildlife disturbance and current drone policies and found that the law is playing catch-up with emerging technology.
 Impacts on wildlife range from disturbance to fatal collisions.
Pip Wallace, CC BY-ND
Impacts on wildlife range from disturbance to fatal collisions.
Pip Wallace, CC BY-ND
This is particularly important in New Zealand, where many threatened species live outside protected reserves. Coastal areas are of particular concern. They provide habitat for numerous threatened and migrating species but also experience high rates of urban development and recreational activity. Different species also respond very differently to the invasion of their airspace.
Where “flying for fun” and pizza delivery by drone combine with insufficient control, there is potential for unanticipated consequences to wildlife.
RPA and red tapeWhen competing interests collide, regulation requires particular care. Any rules on RPAs need to cater for a wide range of users, with varying skills and purposes, and enable beneficial applications while protecting wildlife.
There are strong social and economic drivers for the removal of red tape. Australia and the United States have introduced permissive regimes for lower-risk use, including recreational activity. In New Zealand, RPAs are considered as aircraft and controlled by civil aviation legislation.
Read more: New drone rules: with more eyes in the sky, expect less privacy
Wildlife disturbance, or other impacts on the environment, are not specifically mentioned in these rules and control options depend on existing wildlife law.
The lack of consideration of wildlife impacts in civil aviation rules creates a gap, which is accompanied by an absence of policy guidance. As a consequence, the default position for limiting RPA operations comes from the general requirement for property owner consent.
RPA and spatial controlsRPA operators wanting to fly over conservation land have to get a permit from the Department of Conservation, which has recognised wildlife disturbance as a potential issue.
On other public land, we found that local authorities take a patchy and inconsistent approach to RPA activity, with limited consideration of effects on wildlife. On private land, efforts to control impacts to wildlife depend on the knowledge of property owners.
Protection of wildlife from RPA impacts is further confounded by limitations of legislation that governs the protection of wildlife and resource use and development. The Wildlife Act 1953 needs updating to provide more effective control of disturbance effects to species.
Marine mammals get some protection from aircraft disturbance under species-specific legislation. Other than that, aircraft are exempt from regulation under the Resource Management Act, which only requires noise control for airports. As a result, tools normally used to control spatial impacts, such as protective zoning, setbacks and buffers for habitat and species are not available.
This makes sense for aircraft flying at 8,000m or more, but drones use space differently, are controlled locally, and generate local effects. It is also clear that equipment choices and methods of RPA operation can reduce risks to wildlife.
Keeping drones out of sensitive spacesDunedin City Council in New Zealand recently approved a bylaw banning drones from ecologically sensitive areas. This is a good start but we think a more consistent and universal approach is required to protect threatened species.
As a starter, all RPA operations should be guided by specific policy and made available on civil aviation websites, addressing impacts to wildlife and RPA methods of operation. In addition, we advocate for research into regulatory measures requiring, where appropriate, distance setbacks of RPA operations from threatened and at risk species.
Distance setbacks are already used in the protection of marine mammals from people, aircraft and other sources of disturbance. Setbacks benefit species by acting as a mobile shield in contrast to a fixed area protection.
Congestion of space is a condition of modern life, and the forecast exponential growth of RPA in the environment indicates that space will become even more contested in future, both in the air and on the ground. We argue that stronger measures that recognise the potential impacts on wildlife, how this may differ from species to species, and how this may be concentrated in certain locations, are required to deliver better protection for threatened species.
The authors do not work for, consult, own shares in or receive funding from any company or organisation that would benefit from this article, and have disclosed no relevant affiliations beyond the academic appointment above.
Curious Kids: Do bees ever accidentally sting other bees?
 Bees usually get nectar from flowers, but sometimes they steal it from the nests of other bees. Flickr/Michael Cheng, CC BY-SA
This is an article from Curious Kids, a series for children. The Conversation is asking kids to send in questions they’d like an expert to answer. All questions are welcome – serious, weird or wacky!
Do bees ever accidentally sting other bees? Evie, age 8, Stanwell Park
Hi Evie,
Your question is super interesting. I have spent many years studying and working with different kinds of bees and I’ve never seen a bee accidentally sting another bee - but that doesn’t mean it doesn’t happen. So, I’ve done some reading to try to find out if anybody else has.
There are many different kinds of bees and some live in groups with other bees. The most famous of the bees that live in big groups are honey bees (probably because their honey is so tasty).
Read more: Curious Kids: Why are some shells smooth and some shells corrugated?
Honey bees that live in the same hive are called nestmates because they share a nest. The queen bee lays all the eggs in the hive and has mostly daughters. So usually nestmates are sister-bees that get along very well. They cooperate to feed their little sisters and brothers, collect food, build and protect their nests from animals (or bees from other nests) that want to eat them or their honey.
Because sometimes honey bees steal nectar (the main ingredient for making honey) from other nests, some bees, called guard bees, stand at the door and sniff the bees that land there with their antennae. If the newly landed bee smells like she belongs in the nest, the guard lets her nestmate in. If not, the guard will bite and sting the intruder bee, preventing the intruder from entering the nest.
Read more: How home security resembles dancing honeybees
In experiments where scientists investigate how bees tell whether a bee is their nestmate or not, bees sometimes fail to recognise their nestmates and end up accidentally stinging their sisters! They also sometimes let bees into the hive that are not their nestmates.
So yes, Evie, when trying to defend their nests from intruders, bees sometimes accidentally sting their nestmate sisters, but only because they mistake their sisters for intruders.
I can’t say that I blame them. I’m not sure I’d be so good at recognising my sisters if I had thousands of them.
Hello, curious kids! Have you got a question you’d like an expert to answer? Ask an adult to send your question to us. You can:
* Email your question to curiouskids@theconversation.edu.au
* Tell us on Twitter by tagging @ConversationEDU with the hashtag #curiouskids, or
* Tell us on Facebook
 CC BY-ND
Please tell us your name, age and which city you live in. You can send an audio recording of your question too, if you want. Send as many questions as you like! We won’t be able to answer every question but we will do our best.
Marianne Peso has received past funding from the Australian Produce Council and currently works for the Australian Research Centre-funded Industrial Transformation Training Centre for Fruit Fly Biosecurity Innovation.
Time for pragmatism, not panic, for the electricity market
 There are many viable options for Australia's energy future. Shutterstock
There was a familiar kneejerk reaction to last week’s announcement by the Australian Energy Market Operator (AEMO) that there are risks to our electricity supply after the scheduled closure of the Liddell coal-fired power station in New South Wales in 2022. The sight of the Prime Minister looking for options to keep Liddell open raises the spectre of further reflexive government intervention that can’t end well.
Governments, understandably, want to make sure the lights stay on. But now is the time for perspective, not panic. Because, as the latest Grattan Institute report – Next Generation: the long-term future of the National Electricity Market – shows, there are emerging challenges to the NEM that need dealing with. Make the right decisions now and a return to affordable and reliable electricity supply is on the cards.
Read more: The true cost of keeping the Liddell power plant open
The NEM is an energy-only market. This means that generators only get revenue when they sell their electricity into the market. All costs – including the capital costs of building the plant – need to be covered by the revenue they make when they sell electricity. Anyone who wants to build new generation capacity wants to be pretty certain that the market is going to deliver the revenue they need to cover their costs.
But right now no one is building any generation, unless it is government-backed renewables. This is despite a ripe environment for investment: high current and future prices in the wholesale market and the closure of old power stations. The result, as AEMO pointed out last week, is potential shortfalls in generation and potential blackouts in South Australia, Victoria and NSW over the next few years.
Much of the blame for this investment hiatus can be placed on politicians and the climate change policy mess that is creating so much uncertainty for potential investors.
Read more: Turnbull is pursuing ‘energy certainty’ but what does that actually mean?
But the rise of wind and solar power is also causing problems. Wind and solar energy have zero marginal cost: once the facility is built, the energy produced is essentially free. And they are intermittent suppliers: they don’t produce energy unless the wind is blowing or the sun is shining. So when wind and solar plants are operating, the wholesale price of electricity is forced down. This means there needs to be high prices – sometimes very high – when wind and solar are not operating. This price volatility makes investors nervous that they will not be able to cover the costs of building new generation.
Governments may be tempted to conclude that the market has failed. But intervention may be premature.
There are still five years until Liddell is scheduled to close. Just because a new coal-fired power station will not be built in time to fill the gap doesn’t mean the market cannot respond. Coal was never going to be the market response, given climate change risks. But new gas-fired generators, or batteries to store electricity, could be built in this time frame. Or the market could finally get its act together on what is called demand-response: that is, paying consumers to reduce their electricity consumption during periods of peak demand, so that less new generation is required.
Read more: Managing demand can save two power stations’ worth of energy at peak times
There are no guarantees for government, however. The risks that the market won’t deliver the new generation that is needed are increasing. If nothing changes, Australia will need, in the words of AEMO, “a longer-term approach to retain existing investment and incentivise new investment in flexible dispatchable capability in the NEM”.
Many countries have responded to these same pressures by introducing a capacity mechanism. A capacity mechanism pays generators for being available, regardless of whether they actually sell electricity. Payments for capacity provide extra income for generators, giving them greater assurance that they will make enough revenue to cover their costs.
Any new market-based mechanism in Australia is likely to be better than the scattergun approach of various governments in recent years. Building Snowy 2.0, extending Liddell’s life, or providing state-based backing for new renewable generation might deliver the results needed. But the lack of coordination, planning and strategic thought that sits behind these policies means they probably won’t.
Getting it rightOur report suggests a better way. First, governments should give the market a chance. This means sorting out climate change policy, and quickly. Dithering about a Clean Energy Target, or arriving at a solution that cannot be supported across the political spectrum, will guarantee that investors’ hands remain firmly in their pockets.
Second, work should begin immediately on an additional capacity mechanism, so it is ready if needed. Capacity mechanisms are complex and take a long time to design and implement. There is no one-size-fits-all approach, so careful consideration needs to be given to how one would work in the Australian context.
Finally, AEMO should be asked to provide a more robust assessment of the future adequacy of generation supply. On the basis of this information, the newly formed Energy Security Board should make the judgement on whether an additional capacity mechanism is needed to make sure enough new generation is built.
It is understandable that politicians feel the need to act when faced with the threat of blackouts. After all, they are the ones who get the blame when the lights go out. But caution is needed. Capacity mechanisms are expensive; the peace of mind they bring comes at a price. A pragmatic and planned approach is the best way to ensure that, if a decision is made to redesign our electricity market, that decision is the right one.
David Blowers does not work for, consult, own shares in or receive funding from any company or organisation that would benefit from this article, and has disclosed no relevant affiliations beyond the academic appointment above.
Extreme weather makes homelessness even worse. Here's how we can help
 When this is home, bad weather can make a bad situation much worse. Karen McIntyre, Author provided
The images of Hurricane Harvey in Texas have shown how extreme weather can rob people of their homes. But what about those who have no home to begin with, or whose living situation is already precarious?
Almost one-third of people who have been homeless have suffered extra trauma because of extreme weather, according to our research involving 163 homeless services in Australia and New Zealand.
What’s more, 19% of people in our study cited extreme weather as a factor in their clients becoming homeless in the first place.
Read more: Staying safe in a hotter Australia might depend on your income.
Our study, carried out on behalf of the Australian Attorney-General’s Department and published by the Australian Red Cross, featured surveys, interviews and focus groups involving people with experience of homelessness. We also talked to workers with homeless services and members of the emergency services.
We found that 39% of people who have experienced homelessness lose their home during severe weather.
Vulnerable situationsIn media coverage of weather disasters, both overseas and in Australia, we often hear about how many homes have been damaged. But for those vulnerable to homelessness, the definition of “home” is much broader than this.
Our research focused on people who are already homeless or at risk of homelessness. This broad group includes rough sleepers, people who are couch-surfing or living in vulnerable situations such as temporary caravans, and those escaping domestic violence.
Compared with those who own or officially rent their home, and have access to financial security in the form of income or insurance, these people are especially susceptible to extreme weather. The problem is compounded by the fact that people in vulnerable living situations are also more likely to be suffering problems such as social isolation, mental illness, substance abuse or unemployment.
People in our study said they had lost tents, caravans, temporary structures such as shipping containers and cardboard shelters, and blankets and sleeping bags in open-air areas such as parks. This “loss of shelter” for the homeless community also includes losing a previously safe sleeping area to mud and water – until the area dries out it can’t be used for sleeping.
Less obvious, but critically important for people’s well-being, are the impacts of losing your shelter. During extreme weather, people are more likely to seek shelter in the lee of buildings like churches or public toilets to stay dry. This provides temporary shelter, but increases the risk that they will be moved on, or that they will face aggression and violence.
 No match for a storm.
Joao, Author provided
No match for a storm.
Joao, Author provided
For 19% of people in our survey, experiencing a natural disaster was a factor that helped to tip them over into homelessness. One example is this man’s experience after a bushfire, as related to us by a homelessness service provider:
We had one fellow who was living as a caretaker on a farm. This was [230km away] … [He lost his accommodation because of the bushfires] and because there wasn’t the capability of providing homelessness services for him [there] he walked down to Adelaide and stayed down at the park for a few days until the police here connected him with us.
Besides losing shelter, extreme weather can also trigger mental health issues or worsen existing conditions. Community services working with people experiencing homelessness report that 30% of their clients had experienced mental trauma from an extreme weather event.
These impacts on shelter and mental health illustrate the hardship that extreme weather can bring to people who lack the money or resources to find shelter in a storm.
How communities can helpProviding suitable shelter is crucial. A lack of affordable long-term accommodation, and of short-term options such as drop-in centres with laundries and showers, was the biggest risk factor for people experiencing homelessness during severe weather. In 25% of the extreme weather events we studied, there was no publicly available shelter for people who are homeless.
Access to weather information and warnings is important too. Our research showed that 50% of people experiencing homelessness did not receive any warning of the coming events, and 45% had no access to information about what to do in the event of extreme weather. For those who did receive information and warnings, this was most often through the outreach services provided by community homelessness agencies.
This vital capability can be expanded, for example by providing staff with equipment such as four-wheel drive vehicles in rural and remote areas. This would help not only with disseminating emergency warnings, but also with distributing items such as bottled water, and helping people without transport to reach shelters and hospitals.
Read more: Cyclone Debbie: we can design cities to withstand these natural disasters.
However, homeless services themselves are also highly vulnerable to the impacts of natural disasters. Recent research in Australia found that 25% of community organisations could not recover if their infrastructure was damaged by extreme weather. Extreme weather can damage crucial infrastructure such as shelters and computer networks; it forces staff to work harder to meet the demand for shelter, bedding, food and emergency supplies; and it makes reaching people more difficult in cases where roads are cut off or mobile phone towers have been damaged. As one agency put it: “extreme weather stretches our already disproportionate response to need”.
Without access to housing, to weather information and warnings, to protective items or homeless services, extreme weather deepens the cycle of homelessness, as this service provider in Southeast Queensland described:
The largest event to hit was the flood event of January 2013 which impacted over 30 tenancies we managed as well as hundreds elsewhere in the town. Hundreds of homeless people were also affected as common areas for sleeping outside were near the river or in low-lying areas affected by the flood. This event immediately impacted the customers and continued to have impact over 18 months later with countless numbers still couchsurfing or living in overcrowded situations as a result of loss of housing or camping areas.
Homeless services can prepare by stockpiling items such as weatherproof swags, protective clothing and shoes, mobile phone chargers, cash cards, food and water. Homeless services can also use online emergency planning and preparedness tools like ACOSS’s Resilient Community Organisations Six Steps to Resilience.
But unless the situation improves, those least fortunate can find that they are living with the aftermath of events such as cyclones long after most people have cleaned up and moved on.
This article was coauthored by John Richardson, National Resilience Adviser at Australian Red Cross.
Danielle Every has received funding from the Attorney General's National Emergency Management Program, the Bushfire and Natural Hazards CRC, the Victorian SES, and SAFECOM.
The true cost of keeping the Liddell power plant open
For a long time, Australian governments have believed that the private sector should run the electricity sector. And successive governments have used market instruments to incentivise reducing emissions, by supporting renewables, discouraging coal use, or both.
Now things seem inside out: uncertainty about energy policy mechanisms is pervasive, and the federal government is attempting to broker a deal for the ageing Liddell coal plant to stay open past its planned decommissioning date. It’s possible the plan will require government payments – amounting to a carbon subsidy.
Read more: AGL rejects Turnbull call to keep operating Liddell coal-fired power station
Fear of supply shortages and an appetite for coal have combined with an inability to resolve the political side of energy and climate policy.
Power companies see coal as a technology of the past, but the government seems unready to accept that wind and solar technologies (already the cheapest option for new capacity in Australia) are the future of Australia’s power.
Read more: The day Australia was put on blackout alert
The latest suggestion amounts to deferring serious investment in renewables for a while, fixing up some of the old coal plants up so they can run a few more years, and buying time in the hope of keeping power prices down. Chief Scientist Alan Finkel has backed the idea, at least in principle.
The cost of delaying the inevitableCommissioned in 1972, the Liddell power plant is the oldest of Australia’s large coal-fired stations (after the closure of the Hazelwood station). The New South Wales government sold it to AGL in 2014, at an effective price of zero dollars.
AGL announced some time ago that it will close the plant in 2022 and has considerable financial incentive to do so. This week AGL reiterated this. The latest suggestion is that Delta Electricity might buy and continue to operate Liddell.
What might be the benefits and costs of keeping Liddell running for, say, another decade? We do not know the plant-level technical and economic parameters, but let’s look at the principles and rough magnitudes.
Keeping the plant running longer will require refurbishments, defer the investment costs in renewables, and result in additional emissions, both in carbon dioxide and local air pollutants.
Refurbishment is costly. Finkel put refurbishment costs at A$500-600 million for a 10-year extension. Such refurbishment might achieve an increase in efficiency – as GE, a maker of power station equipment, recently argued – but perhaps not by much for a very old plant like Liddell.
Read more: Coal and the Coalition: the policy knot that still won’t untie
And refurbishment might not work so well, as the experience with the Muja plant in Western Australia shows: A$300 million was spent on refurbishment that ultimately failed. Spending big money on outdated equipment is not a particularly attractive option for energy companies, as AGL’s CEO recently pointed out.
Liddell’s power output during 2015-16 was around 8 terawatt hours – about 10% of present NSW power supply (it was more in 2016-17, and less in previous years). It might well be lower as the plant ages.
Ironically, the reduction in the Renewable Energy Target, from 41 to 33 terawatt hours per year, almost exactly matches Liddell’s present power output. With the original RET target, new renewables would have covered Liddell’s output by 2020.
Liddell emitted around 7.5 million tonnes of carbon dioxide per year in 2015-2016. With the assumed reduction in output and some improvement in CO₂ emissions intensity, the carbon dioxide output might be in the order of 5-6 million tonnes per year, or 50-60 million tonnes over ten years.
If the government were to pay for the refurbishment, as has been suggested, this would equate to subsidising CO₂ emissions at a rate of perhaps $10 per tonne, compared to the alternative of replacing Liddell with renewable power.
Read more: FactCheck Q&A: is coal still cheaper than renewables as an energy source?
At the same time, the government is paying for projects to reduce emissions, at average prices of around $12 per tonne of carbon dioxide, under the Emissions Reduction Fund. The contradiction is self-evident. Furthermore, keeping more coal plants operational deters commercial investment in any kind of new plants.
Of course this needs to be seen in the context of supply security, any subsidies that might be paid in future to renewable energy generators, and the possibility that a Clean Energy Target will determine overall emissions from electricity production irrespective of whether Liddell operates or not. It’s complicated. But the fundamental point is clear: paying for an old coal plant to operate for longer means spending money to lock things in, and delay the needed transition to clean power.
A possible compromise might be to mothball the Liddell plant, to use if supply shortages loom, for example, on hot summer days. But such a “reserve” model could mean very high costs per unit of electricity produced.
It is not clear that it would be cheaper than a combination of energy storage and flexible demand-side responses. And it may be unreliable, especially as the plant ages further. During the NSW heatwave last summer Liddell was not able to run full tilt because of technical problems.
A market model to pay for reserve capacity would surely do better than government direction.
Australia’s energy companies have been calling for a mechanism to support new clean investment, such as the Clean Energy Target. And many would no doubt be content to simply see a broad-based, long-term carbon price, which remains the best economic option. If the policy framework was stable, private companies would go ahead with required investment in new capacity.
Read more: Finkel’s Clean Energy Target plan ‘better than nothing’: economists poll
Meanwhile, federal and state governments are intervening ad-hoc in the market – making a deal to keep an old plant open here, building and owning new equipment there. It is the worst of all worlds: a market-based system but with extensive and unpredictable intervention by governments that tend to undermine investor confidence.
Frank Jotzo is in charge of research funded by different bodies including the Australian government. None of the research funding constitutes a conflict of interest for this article.
Zeba Anjum does not work for, consult, own shares in or receive funding from any company or organization that would benefit from this article, and has disclosed no relevant affiliations beyond the academic appointment above.
Just ten MPs represent more than 600 threatened species in their electorates
 The critically endangered Leadbeater's Possum lives within a single federal electorate. Their local MP has a responsibility to be their voice. Zoos Victoria
Australia is rapidly losing its world-famous biodiversity. More than 90 species have gone extinct since European colonisation (including three in just the past decade), and more than 1,700 species are now formally recognised as being in danger of extinction.
Despite the pride many Australians feel in our unique natural heritage (and the billions of dollars made from nature-based tourism) the amount of federal funding for biodiversity conservation has dropped by 37% since 2013.
Read more: The environment needs billions of dollars more: here’s how to raise the money
If a local industry or public institution experienced such a drastic funding cut, the people affected would petition their local representatives and the issue would be raised in parliament as a matter of local or national importance.
Threatened species cannot of course lobby government. But all threatened species on the land have at least one elected official who should take responsibility for them.
Threatened species as local constituentsA member of parliament’s primary job, besides being a party member and parliamentarian, is to speak up for local interests. Data from the Species of National Environmental Significance shows that every federal electorate contains at least one threatened species, so every single federally elected politician has a role to play in abating species extinction.
We’ve used that data to create an interactive map that shows the number of threatened species in each federal electorate, along with details of the local MP and their party. It’s obvious from a glance that a handful electorates contain most of Australia’s threatened species. (You can click on an electorate to view information on the local member, and to download its threatened species lists.)
This is because species are not uniformly spread across the landscape, and also because electorate size varies hugely according to population density. The biggest electorate is the Division of Durack, which at 1.6 million square kilometres is half the size of Germany, while the smallest (the Division of Grayndler in inner Sydney) is 0.002% Durack’s size.
Because extremely large seats are in remote and rural areas, they are dominated by Liberal and National politicians. Melissa Price, the Liberal member for Durack, represents 359 threatened species, or about 20% of Australia’s total.
The box below highlights the 10 seats with the most threatened species. Between them, the members for these 10 electorates represent 609 – or 36% – of all threatened species in Australia. These MPs need to be empowered to protect the natural heritage of their electorates.
 Green Fire Science, CC BY-ND
While this issue affects every MP, some 79 electorates contain a species that resides mainly – or even only – inside that electoral boundary. Several electorates have more than 50 species that rely on habitat found in one electorate, including the divisions of Durack (Liberal), O’Connor (Liberal), Lingiari (Labor), and Lyons (Labor).
The figure below shows electorates that contain more than 80% of a species’ range. The size of the bubble scales directly to the size of the electorate. It’s clear that some electorates are important sites of biodiversity.
 Author provided
For example, Warren Entsch, the Liberal National member for Leichardt, has the endangered Golden shouldered parrot living entirely within his electoral boundaries. The federal division of Canberra, represented by Labour MP Gai Brodtmann, contains the entire habitat of the spectacular Brindabella Midge-orchid. These are just two of 79 members who can make such a claim.
Local members should not just be aware of this but active in saving these species.
While many of the factors that imperil threatened species come from far outside an electorate’s borders, local threatened species need local voices. As arguably the strongest local voice, all federal MPs can fight for more money and more action for threatened species, especially those within their electoral boundaries. And given the inequity in terms of threatened species per electorate, some will need to fight for much greater resourcing than others.
Extinction is forever, and every time we lose a species our world becomes a poorer place. Ultimately, only local action on the ground can prevent the irreversible loss of our precious threatened species.
James Watson receives funding from the Australian Research Council, the National Environmental Science Programme and the Science for Nature and People Partnership. He is the Director of the Science and Research Initiative at the Wildlife Conservation Society.
April Reside receives funding from NESP Threatened Species Recovery Hub. She sits on the Black-throated Finch Recovery Team and Birdlife Australia's Research and Conservation Committee.
Hugh Possingham receives research funding from The Australian Research Council, the National Environmental Science Program and other small granting agencies. He is employed by The Nature Conservancy.
Martine Maron receives funding from the Australian Research Council, the National Environmental Science Programme, the Science for Nature and People Partnership, and the NSW Office of Environment and Heritage. She is a Director of BirdLife Australia and a Governor of WWF Australia.
Michelle Ward receives funding from an Australian Postgraduate Award. She is a volunteer for Wildcare Australia and a Commission Member for the IUCN WCPA.
Richard Fuller receives funding from the Australian Research Council and the National Environmental Science Programme.
Stephen Kearney receives funding from an Australian Postgraduate Award.
Brooke Williams and Scott Consaul Atkinson do not work for, consult, own shares in or receive funding from any company or organization that would benefit from this article, and has disclosed no relevant affiliations beyond the academic appointment above.
Coal and the Coalition: the policy knot that still won't untie
As the Turnbull government ties itself in yet more knots over the future of coal-fired power, it’s worth reflecting that climate and energy policy have been a bloody business for almost a decade now.
There was a brief period of consensus ushered in by John Howard’s belated realisation in 2006 that a price had to be put on carbon dioxide emissions. But by December 2009 the Nationals, and enough Liberals, had decided that this was a mistake, and have opposed explicit carbon pricing ever since.
Read more: Ten years of backflips over emissions trading leave climate policy in the lurch.
The resulting policy uncertainty has caused an investment drought which has contributed to higher energy prices. Now, with prices a hot potato, there are thought bubbles about extending the life of coal-fired power stations and a new effort to set up a Conservatives for Conservation group.
But the Liberal Party’s tussles over climate and energy policy (as distinct from denying the science itself) go back even further – some 30 years.
Early days and ‘early’ actionIt’s hard to believe it now, but the Liberal Party took a stronger emissions target than Labor to the 1990 Federal election. Yet green-minded voters were not persuaded, and Labor squeaked home with their support. After that episode the Liberals largely gave on courting green voters, and under new leader John Hewson the party tacked right. Ironically, considering Hewson’s climate advocacy today, back then his Fightback! policy was as silent on climate change as it was on the price of birthday cakes.
In his excellent 2007 book High and Dry, former Liberal speech writer Guy Pearse recounts how in the mid-1990s he contacted the Australian Conservation Foundation, offering to to canvass Coalition MPs to “find the most promising areas of common ground” on which to work when the party returned to government. The ACF was “enthusiastic, if a little bemused at the novelty of a Liberal wanting to work with them”. Most Liberal MPs – including future environment minister Robert Hill and future prime minister Tony Abbott – were “strongly supportive” of the idea. But others (Pearse names Eric Abetz and Peter McGauran) were “paranoid that some kind of trap was being laid”. Nothing came of it.
Elected in 1996, Howard continued the staunch hostility to the United Nations climate negotiations that his Labor predecessor Paul Keating had begun. Not all businessmen were happy. Leading up to the crucial Kyoto summit in 1997, the Sydney Morning Herald reported how a “delegation of scientists and financiers” led by Howard’s local party branch manager Robert Vincin and Liberal Party grandee Sir John Carrick lobbied the prime minister to take a more progressive approach. Howard did not bend.
Howard stayed unmoved until 2006 when, facing a perfect storm of rising public climate awareness and spiralling poll numbers, he finally relented. Earlier that year a group of businesses convened by the Australian Conservation Foundation produced a report titled The Early Case for Business Action. “Early” is debatable, given that climate change had already been a political issue since 1988, but more saliently the report tentatively suggested introducing a carbon price. And Howard finally relented.
The carbon warsThe ensuing ten years after Kevin Rudd’s defeat of Howard don’t need much recapping here (go here for all the details). But one interesting phenomenon that has emerged from the policy wreckage is the emergence of some very unusual coalitions to beg for certainty.
In 2015, in the leadup to the crucial Paris climate talks, an “unprecedented alliance” of business, union, environmental, investor and welfare groups called the Australian Climate Roundtable sprang briefly into life to make the case for action.
Then, after the seminal South Australia blackout last September, a surprisingly diverse group of industry and consumer bodies – the Australian Energy Council, Australian Industry Group, Business Council of Australia, Clean Energy Council, Energy Users Association, Energy Consumers Australia, Energy Networks Association and Energy Efficiency Council – called on federal and state energy ministers to “work together to craft a cooperative and strategic response to the transformation underway in Australia’s energy system”.
Read more: Who tilts at windmills? Explaining hostility to renewables.
It’s in this light that the new Conseratives for Conservation lobbying effort should be seen. Its spearhead Kristina Photios surely knows she has no chance of converting the committed denialists, but she can chip away at the waverers currently giving them comfort and power.
Questions on noticeOf course, there are always cultural (or even psychological) issues, but you’d think that conservation would be a no-brainer for conservatives (the clue should be in the name).
There are a few questions, of course (with my answers in brackets).
Where were all the people who are now calling for policy certainty back in 2011 when Tony Abbott was declaring his oath to kill off the carbon tax? (They were AWOL.)
Will any business show any interest in building a new coal-fired power station? (No.)
Is renewable energy technology now advanced enough for them to make serious money? (We shall see.)
Can we make up for lost time in our emissions reductions? (No, and we have already ensured more climate misery than there would have been with genuinely early climate action.)
Will the Liberals further water down the Clean Energy Target proposal? (Probably.)
What will Tony Abbott say to UK climate sceptic think tank the Global Warming Policy Foundation when he gives a speech on October 6? (Who knows – grab your popcorn!).
What will happen to the Liberals in the medium term? (Who knows, but Michelle Grattan of this parish has some intriguing ideas.)
Are there reasons to be cheerful? (Renewable energy journalist Ketan Joshi thinks so.)
Perhaps the last word on this issue should go to John Hewson, who noted last year:
The “right” love to speak of the debt and deficit problem as a form of “intergenerational theft”, yet they fail to see the climate challenge in the same terms, even though the consequences of failing to address it substantively, and as a matter of urgency, would dwarf that of the debt problem. The “right” is simply “wrong”. It’s political opportunism of the worst sort, and their children and grandchildren will pay the price.
The day Australia was put on blackout alert
 One big mess: the market has failed to deliver on cheap, reliable energy. Shutterstock
The only way the Australian Energy Market Operator (AEMO) could be blunter in its report on the state of our electricity system would be to stick a neon sign on top of its Melbourne head office saying “The market has failed”.
AEMO’s Advice to Commonwealth Government on Dispatchable Capability, released today, shows there are significant but manageable risks of the lights going out in South Australia and Victoria over the next two summers. And beyond 2018, AEMO will need more tools if shortfall risks are going to be dealt with.
The conclusions about the short-term risks are not surprising. AEMO has issued several reports over the past year or so telegraphing supply shortfalls in the next couple of years.
What is surprising is its view that action needs to be taken when Liddell, the AGL-owned power station in New South Wales, closes in 2022. That is five years away, and AGL has been trumpeting the decision at every opportunity, but AEMO is clearly not confident that the market will respond by delivering new generation, or storage, or demand response, to fill the gap.
Read more: AGL rejects Turnbull call to keep operating Liddell coal-fired power station
AEMO recommends immediate development of a strategic reserve that it can deploy to prevent loss of power over the next few summers. A strategic reserve is basically back-up generation (or storage or demand response) that is used only in an emergency.
AEMO’s job is to make sure there is enough generation available – that supply equals demand. A strategic reserve will deliver the capacity – be it gas generation, storage or demand response – that it needs to meet any shortfall. Neither coal nor wind and solar can fulfil this function. Coal takes too long to come online, while wind and solar provide intermittent supply so there is no certainty that renewable energy will be there when needed.
Read more: Managing demand can save two power stations’ worth of energy at peak times
A strategic reserve is an insurance policy, only to be used in extreme circumstances. And like any insurance policy it has a cost – a cost that will be passed on to consumers. Of course, if electricity keeps being delivered as required over the next two summers, governments and consumers may well consider this money well spent.
But a strategic reserve does not deal with the second problem AEMO is seeking to solve: that not enough dispatchable generation is being built in the National Electricity Market. Even with backup generation controlled by AEMO, Australia will still need new generation to provide day-to-day power when existing power stations such as Liddell close.
AEMO’s second major recommendation is the immediate “development of a longer-term approach to retain existing investment and incentivise new investment in flexible dispatchable capability in the NEM”.
Read more: The government’s new energy plans will leave investors less confident than ever
Since it was set up 20 years ago, the NEM has delivered sufficient generation to meet demand, and at a reasonable cost. But this report makes it clear that AEMO believes this is no longer the case and that changes to the market are needed.
The report is understandably silent on what this “longer-term approach” might look like, given that market design is tricky. But the report is unequivocal that a new mechanism needs to be in place by the time Liddell closes. If not, supply shortages – and the associated loss of power to consumers – will be far more likely.
AEMO has provided the federal government with a pathway to securing electricity supply for the foreseeable future. There will be costs, but all governments will have greater assurances that the lights will stay on.
What AEMO hasn’t done is call out the policy instability that has been a major reason we have got ourselves into this mess. Commentators, Chief Scientist Alan Finkel, and numerous industry players – including the Big Three owners of generation in Australia – have all long been arguing that the major barrier to investment in the NEM has been the dog’s breakfast that is climate change policy.
The federal government can use this report to satisfy critics within its own party that there is a plan to ensure enough dispatchable generation in the NEM.
But the government must not use AEMO’s report as a get-out clause that allows it to continue to avoid creating an effective emissions reduction policy in the electricity sector. If anything, the report should stand as a stark warning to politicians of all stripes about what happens when you get policy so badly wrong.
Bipartisan agreement on the only politically acceptable emissions reduction policy – a Clean Energy Target – may not be sufficient, but remains absolutely necessary, to ensure there is enough generation to meet Australia’s electricity needs.
AEMO has shown it is willing to do its job. It is now up to our politicians to do theirs.
David Blowers does not work for, consult, own shares in or receive funding from any company or organisation that would benefit from this article, and has disclosed no relevant affiliations beyond the academic appointment above.
Seven ways to protect your pets in an emergency
If you’ve been following media coverage of the post-hurricane flooding in Texas during the last couple of weeks, you will have seen many images and accounts of people evacuating with their pets.
You will no doubt also have seen emergency responders and volunteers rescuing abandoned pets and stranded horses and livestock. Similar stories play out during all types of natural disasters, whether they’re floods, cyclones, or bushfires.
An estimated 63% of Australian households have at least one pet – one of the highest rates of pet ownership in the world – and including those pets in your emergency plan can be vital.
Last week a New South Wales coronial inquest into the 2015 Hunter Valley floods heard that an elderly resident who drowned refused to leave her home without her dog and bird, prompting parliamentary questions to the NSW minister for emergency services over provisions for animals in emergencies.
Read more: Dry winter primes Sydney Basin for early start of bushfire season
I have spent the past three years leading a project on animal management in emergencies, which considers the challenges for emergency responders, as well as owners of pets, horses, pet livestock, animal-related businesses, and livestock farmers.
Recently we have teamed up with a community-led group in the Blue Mountains, Blue ARC Animal Ready Community, to focus on identifying and helping to solve local challenges and barriers to emergency preparedness and planning for animals.
 Research suggests people often forget to include their chooks in household emergency plans.
REUTERS/Carlo Allegri
Research suggests people often forget to include their chooks in household emergency plans.
REUTERS/Carlo Allegri
So if you have animals, what can you do to protect them? The first thing to do is check general resources on emergency plans. Unfortunately there is no Australia-wide emergency response approach, so it’s important to make plans that are suited to your own situation and the help you have available.
Here are my top tips for taking care of your animals in an emergency:
It sounds obvious, but creating an emergency plan that includes pets is the first step. If you don’t have a household plan, the Australian Red Cross Rediplan is a good place to start. Consider a range of potential emergencies in your planning: heatwaves, prolonged loss of power, floods, cyclones and bushfires. Most importantly, think about every creature in your household: our research suggests that chooks are popular but often not considered when it comes to emergency planning.
Plan to leave early. Evacuating with animals can take longer, especially when you have multiple types of animals or need to make multiple journeys. Don’t plan to leave animals behind, or plan to leave a household member behind to take care of the animals. Stay aware of weather conditions and emergency warnings.
Have an emergency kit for your animals: fill a “go bag” (or box) with items you’ll need if you need to leave in a hurry. If you have essentials you can’t afford to leave in a box, make a checklist and know where they are. There are some excellent checklists available online to get you started.
Plan where you will take your animals. Emergency services can’t help evacuate your pets or larger animals in emergency situations, and not all evacuation centres will accept them. The official position is that your animals are your responsibility, so you need to know where you’ll take your animals and how you’ll get them there. Most people rely on taking them to friends or family, but this can sometimes mean that different animals need to go to different places.
Read more: With the rise of apartment living, what’s a nation of pet owners to do?
Plan for what will happen if you’re not at home, or can’t get back home. No one likes considering this situation, but it is often a reality. Speak to neighbours or nearby friends about what you would like them to do if you’re not home (and offer them your support if they’re away). Make sure you have contact numbers for neighbours and those who might be able to help in these situations.
If you have horses or other large animals, find a buddy. Horses, and other large pet livestock, are special cases in emergencies: their size means that there are additional challenges in their handling, loading, transportation, and relocation. Many equine groups have guidance for horse owners, and advocate buddy systems to help owners. There are also networking systems, such as Walking Forward Disaster Relief Team, that help horse owners prearrange safer places to relocate their animals ahead of emergencies.
Hardest of all: practice your plan. Most emergency preparedness advice suggests that you practice your plan, but it’s particularly important with pets. It’s better to find out early that your ideal plan doesn’t work in practice. Finding work-arounds, and making a plan B and C, is far easier without the threat of imminent danger.
Remember, your animals depend on you. Plan for all the human and non-human animals in your household, and stay safe.
September 16 and 17, 2017, is the NSW Rural Fire Service-led Get Ready weekend, with various bushfire awareness and preparedness activities being planned across the state. To support that event in the Blue Mountains we have co-developed, with Blue ARC and the Resilience and Preparedness Group, posters and flyers encouraging residents to make an emergency plan for all the family, including links to useful resources.
Mel Taylor receives funding from the Bushfire and Natural Hazards Cooperative Research Centre
Two centuries of continuous volcanic eruption may have triggered the end of the ice age
 The Mt. Takeha volcano in west Antartica rises more than 2,000 metres above the surrounding ice sheet. Wikimedia commons
Around 25,000 years ago, during a period known as the Last Glacial Maximum, ice covered much of the world’s landmasses. Comparatively weaker sunlight, large continental ice sheets, and very low amounts of carbon dioxide in the air created the right conditions for an ice age. During the next 15,000 years the global climate shifted from glacial to warm, interglacial conditions as sunlight strengthened.
But the Southern Hemisphere’s climate changed abruptly roughly 18,000 years ago. Rather than the gradual decline you might expect as Earth’s orbit slowly drew nearer to the Sun, something triggered a widespread and simultaneous abrupt change in climate across many continents.
In research published today in Proceedings of the National Academy of Sciences, an international group of researchers and I discovered that a unique, 192-year series of massive volcanic eruptions coincided exactly with the onset of this period of rapid, widespread Southern Hemisphere climate change.
Read more: Volcanoes under the ice: melting Antarctic ice could fight climate change
These abrupt climate changes included the pronounced retreat of glaciers in Patagonia and New Zealand and reduced aridity in southern Australia. Lakes rapidly expanded in the Bolivian Andes, and summertime rain in subtropical Brazil increased. Atmospheric dust, recorded in ocean sediment and Antarctic ice cores, was sharply reduced.
Many of these changes have been attributed to a sudden poleward shift in westerly winds encircling Antarctica. The shifting winds changed ocean circulation and ventilation in the deep ocean, affecting glaciers across the southern hemisphere.
What our research explains for the first time is why the winds suddenly changed, and why there was a simultaneous climate transformation across the whole Southern Hemisphere.
Clues within the iceAntarctica has always been home to globally significant volcanoes. However, 17,700 years ago a unique event began: nearly continuous volcanic eruptions over 192 years that spewed huge amounts of chemicals known as halogens into the Antarctic atmosphere.
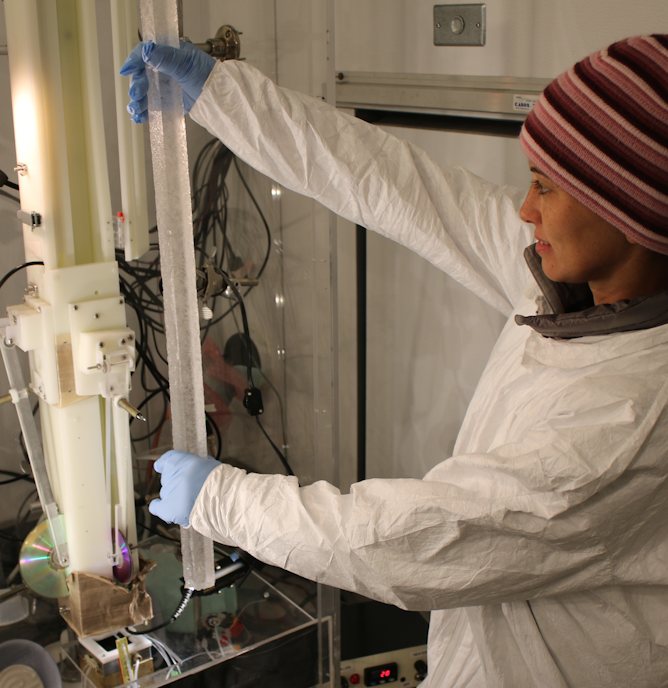 A researcher loads 18,000-year-old Antarctic ice for continuous analysis.
PNAS, CC BY
A researcher loads 18,000-year-old Antarctic ice for continuous analysis.
PNAS, CC BY
These halogens – including powerful ozone destroyers bromine, chloride and iodine – created a hole in the ozone layer, which was in many ways similar to the modern hole triggered by humans’ use of halogen-containing compounds called CFCs. This led to large-scale changes in atmospheric circulation and initiated the shift away from a glacial climate state.
These findings are based on detailed chemical measurements of a broad range of elements and chemical traces in Antarctic ice cores. Most of these came from the West Antarctic Ice Sheet Divide (WAIS), a 3,405 metre deep drilling site that provides highly precise climate records over the past 68,000 years.
Read more: Explainer: what are ice cores?
Our research included the broadest suite of chemical and elemental analysis ever attempted on a deep ice core, and the most precise breakdown of time. This record of the eruptions was precisely duplicated in replicate samples from the same ice core, and in ice cores taken from near Byrd Station in West Antarctica, and Taylor Glacier in Antartica’s Dry Valleys.
The ice core records showed a very unusual, 192-year chemical anomaly from 17,748 to 17,556 years before present.
We augmented the high resolution ice core analyses with a host of lower resolution measurements of interplanetary dust, rock fragments ejected during volcanic eruptions, and sulphur isotopes. Together, they clearly showed the chemical anomaly was the result of a series of massive volcanic eruptions from Mt Takahe, about 350km north of our main drill site.
Other characteristics of the chemical record – including anomalies in sulfur isotopes and near complete bromine depletion in the ice during the event – were consistent with increased ultraviolet radiation at Earth’s surface. It suggests that halogens (chlorine, bromine, and iodine) and other material from the Mt Takahe eruptions reached the Antarctic stratosphere where they destroyed ozone.
 The massive, halogen-rich eruptions of Mt. Takahe coincided with the onset of abrupt and widespread climate change in the southern hemisphere, and increasing greenhouse gas concentrations during the end of the last ice age.
Author provided
The massive, halogen-rich eruptions of Mt. Takahe coincided with the onset of abrupt and widespread climate change in the southern hemisphere, and increasing greenhouse gas concentrations during the end of the last ice age.
Author provided
These eruptions and their chemical signature are unique in the 68,000-year WAIS Divide record. Fallout containing elevated levels of hydrofluoric and hydrochloric acid, as well as toxic heavy metals, extended at least 2,800km from Mt Takahe and may have reached southern South America.
Correlation vs causationThe Southern Hemisphere’s glaciers took 10,000 years to fully retreat. But these unique volcanic eruptions occurred just before (or possibly during) the most significant period of rapid climate change in the Southern Hemisphere, and global greenhouse gas concentrations increased during this time.
The fundamental question is: “did these two events occur at the same time by coincidence or were they causally linked?” The probability that these two events coincided simply by chance is negligible. Based on the evidence we found in Antartica’s ice cores, the depletion of the ozone layer may be the crucial linking factor.
We can bolster this link by comparing the climate change of 17,700 years ago to observable climate change today attributed to the modern Antarctic ozone hole. We can also look to climate models that simulate the behaviour of an ozone hole under glacial conditions. Overall, the widespread climate change observed in many paleoclimate records can best be explained by this singular and dramatic event in western Antarctica.
Joe McConnell receives funding from U.S. National Science Foundation.
New Zealand’s fisheries quota management system: on an undeserved pedestal
 Snapper is one of the fish under New Zealand's Quota Management system. from www.shutterstock.com, CC BY-ND
In popular imagination, New Zealand’s fisheries management system is a globally recognised story of sustainability, reflecting a “clean and green” environmental ethos.
Indeed, New Zealand’s fisheries have been ranked among the best managed in the world - an accolade based on the early and wholehearted adoption of a Quota Management System (QMS).
This perception is echoed in a recently published article, but we take issue with the methodology and its conclusions. Claims that New Zealand’s QMS is an unmitigated success simply do not match the facts.
How New Zealand’s QMS works Scallops are among the species managed by the QMS.
from www.shutterstock.com, CC BY-ND
Scallops are among the species managed by the QMS.
from www.shutterstock.com, CC BY-ND
The fundamental idea behind the QMS is that fishers own (or lease) the right to catch a certain proportion (quota) of the Total Allowable Catch (TAC) of a certain species of fish. These quotas can be freely traded. Market forces are assumed to achieve economically optimal outcomes.
The TAC is set via an assessment process incorporating biological data and fisheries information, where available. The TAC is supposed to ensure sustainability.
New Zealand is committed to the most comprehensive QMS, more so than any other fishing nation. The system is a seductively straightforward solution to control commercial fishing effort.
Currently, TACs are set for more than 640 fish stocks, and represent around 620,000 tonnes of fish. But not all stocks undergo an empirical stock assessment.
Because proposals for downward change usually meet resistance from the fishing industry, changing a TAC requires a persuasive case. Most have not changed in response to either over catching or under catching (a consequence of budgetary constraints and political lobbying by powerful quota owners).
From a TAC, allowances are made for customary catch by Māori, recreational fishing and other mortality caused by fishing, for example through poaching. The remainder is the total allowable commercial catch (TACC), which is divided among the quota owners in the form of Annual Catch Entitlements (ACE).
 Red snapper at Auckland’s fish market.
from www.shutterstock.com, CC BY-ND
Trading quota vs catching fish
Red snapper at Auckland’s fish market.
from www.shutterstock.com, CC BY-ND
Trading quota vs catching fish
When fishers do not have enough ACE to cover their catch, they must either buy more or pay a penalty to the government. Both quota and ACE can be bought, sold and leased. One of the unfortunate consequences of the QMS is that more money is made through trading ACE than actually catching the fish. Unsurprisingly, this empowers quota owners at the expense of fishers.
In our rebuttal to the original article, we point out that fish stocks are nowhere near as healthy as suggested. There is a lack of scientific data to correctly run the QMS. Three quarters of fish stocks have no formal or detailed assessment, and very few have independent research surveys.
Most assessments rely on industry self-reported catch and effort data, rather than independent surveys. This is a dangerous strategy, as shown by the collapse of the Canadian Newfoundland Cod stocks in 1992. At that time, fisheries managers chose to believe industry data showing increasing catch per unit effort, rather than scientific surveys suggesting precipitous decline.
Wider ecosystems effects ignoredFunding for stock assessments has significantly decreased; it is about 45% of the levels in the early 1990s while the number of fish stocks in the QMS has increased 3.5-fold.
The broader environmental effects of commercial fishing on biodiversity, endangered species, seafloor habitats and the very ecosystem that supports the fish on which fisheries depend, are becoming increasingly obvious. Even so, little research targets these impacts. New Zealand’s QMS is a data hungry beast and it is starving.
As with all markets, not all behaviours that are incentivised are virtuous. There is money to be made or saved by dumping catches for which ACE is unavailable or too expensive, from poaching and falsifying catch returns. These behaviours have seriously distorted New Zealand’s catch data for decades. This includes massive dumping of unwanted catch and under-reported bycatch, including endangered dolphins and sealions.
Read more: Things fall apart: why do the ecosystems we depend on collapse
Compounding this is the low level of onboard observer coverage (about 8.4% in offshore fisheries and less than 1% inshore) and the lack of effective enforcement. An independent review of New Zealand’s Ministry for Primary Industries (MPI) handling of illegal fish and dolphin dumping revealed industry capture of the regulator, involving flawed processes and inappropriate conduct.
A senior MPI manager admitted that:
… discarding is a systemic failure of the current system and something we have not been able to get on top of from day 1 of the QMS.
Thus, the QMS is not just starved of data: what little data it gets is highly questionable. MPI itself, succinctly illustrates the situation in the below diagram.
 Glenn Simmons, CC BY-ND
New Zealand’s fishers are firmly trapped in the cycle of non-reporting. The recent government decision to place electronic monitoring and CCTV cameras on every vessel indicates the gravity of the situation. This, however, does nothing to remove the perverse incentives inherent in the QMS itself.
Comprehensive review neededThe QMS has undermined jobs and livelihoods - just five large companies own over 80% of quota, and 60% of the offshore catch is taken by foreign charter vessels (FCVs) under contract to New Zealand fishing companies. These FCVs arrive with foreign crew, denying employment to New Zealanders, and outsource value added processing to Asia.
For decades FCVs, have been associated with the inhumane treatment of migrant fishers working in slave-like conditions. Despite new laws, abusive treatment has continued.
Concentration of quota in the hands of a few has resulted in many disenfranchised fishers. There is a sense of hopelessness over their activities and alienation from the management of the resource they depend on. Tellingly, Iceland, a nation strongly associated with fishing, described ITQs as feudal, quota holders as lords of the seas and fishermen as serfs.
Just last month, the Faroese Islands’ fishing industry overwhelmingly rejected a quota management system. They had too many questions and too little evidence to support adoption of a QMS.
Ultimately, we need to lower the QMS from its undeserved pedestal, acknowledge its limitations and move forward through open and honest debate. We should also look beyond our own shores for ideas, as New Zealand is not the only country wrestling with these problems.
There are lessons to be learned from New Zealand’s QMS, and they are not all good. After 30 years, New Zealand’s fisheries management needs a comprehensive review.
We acknowledge the contribution of Philip Clarke, a former forensic scientist and fisheries compliance investigator for the New Zealand Ministry for Primary Industries.
Steve Dawson's research has had funding from DOC and MPI, but not on projects directly related to fisheries.
(David) Hugh Whittaker, Bruce Robertson, Elisabeth Slooten, Fiona McCormack, Glenn Simmons, Graeme Bremner, Nigel Haworth, and Simon Francis Thrush do not work for, consult, own shares in or receive funding from any company or organisation that would benefit from this article, and has disclosed no relevant affiliations beyond the academic appointment above.
I have always wondered: why are some fruits poisonous?
 It was all the apple's fault: we've been fascinated by poisoned fruit for a long time. Jacob Jordaens (1593–1678), The Fall of Man, via Wikimedia Commons
This is an article from I Have Always Wondered, a new series where readers send in questions they’d like an expert to answer. Send your question to alwayswondered@theconversation.edu.au
Why are some fruits poisonous when the objective of fruit is, presumably, to be eaten so that the seeds can be widely distributed with nutritive manure? – Sev Clarke, Mt Macedon
Poison fruit has captured our imaginations for centuries. Snow White’s death sleep was induced by the evil queen’s gift of a poison-laced apple. It is rumoured that deadly nightshade, a plant with naturally occurring fruit toxins, was used to kill a Roman emperor and halt an invasion of Scotland. A deadly dose of ricin from castor beans was administered to a Bulgarian dissident via the tip of an umbrella.
More recently, scientists have been trying to understand why some fruits are naturally poisonous. From the vain queen’s point of view it makes sense to poison an apple and feed it to the fairest in the land. But why do some plants offer poison fruit that has the potential to harm – or at least deter – fruit-eating animals?
Read more: Little shop of horrors: the Australian plants that can kill you
Fruiting plants and fruit-eating animals have “mutualistic relationships”, where each benefits from the other. Plants need to spread their seeds to colonise new territory, recolonise after disturbance, or avoid the dangers of staying at home (for example, if the parent plant harbours pests).
One way of doing this is to encase seeds in nutritious fruit pulp so that animals eat the fruit, digest the pulp, and later excrete the seeds with a helpful fertilising deposit of manure.
Animal-mediated (as opposed to wind- or water-mediated) seed dispersal can be particularly useful for getting seeds to specific locations. If you’ve ever wondered how parasitic mistletoe plants or strangler figs find their way onto branches high up in trees, fruit-eating birds are the answer. But why poison the pulp?
 Birds spreading seeds are vital for many plants, so there has to be a very good reason to risk deterring them with toxic fruit.
Matt MacGillivray/Flickr, CC BY
Don’t you know that you’re toxic?
Birds spreading seeds are vital for many plants, so there has to be a very good reason to risk deterring them with toxic fruit.
Matt MacGillivray/Flickr, CC BY
Don’t you know that you’re toxic?
First, how do plants poison the pulp? Plants produce a range of chemical compounds, some of which have no apparent function in primary life-maintaining processes and so are called secondary compounds.
Potentially poisonous secondary compounds are produced either in the course of development from seed to adult plant, or in direct response to attacks from plant-eaters.
Poisons in fruit pulp are typically produced during development. Unripe fruit is often toxic to protect immature seeds from attack or premature dispersal, but ripe fruit with mature seeds can also be poisonous.
So how do we explain fruit that remains poisonous even when it’s ripe and ready for dispersal? One theory is that a low level of poison in fruit encourages fruit-eating animals to move away from the parent plant (avoiding additional poison), therefore carrying seeds further away.
In some cases toxins cause constipation, ensuring that seeds stay longer in the gut and so increasing the distance they are carried. In other cases – think of prunes – they act as laxatives to ensure the quick passage of seeds with minimal time for seed damage during digestion.
There is some evidence for these hypotheses, but they’re not the full story.
There’s good fruit-eating and bad fruit-eatingNot everything that eats fruit is good for the plant. Toxins in fruit might specifically target animals, microbes and fungi that damage its seeds, while being non-toxic to species that are good seed dispersers. The fruit of deadly nightshade is lethal to many mammals but apparently harmless to some birds, and Mediterranean buckthorn fruits are toxic to some insect pests but not seed-dispersing birds.
 The fruit of deadly nightshade is poisonous to many mammals, but not the birds that carry its seeds.
Andreas Rockstein/Flickr, CC BY-SA
The fruit of deadly nightshade is poisonous to many mammals, but not the birds that carry its seeds.
Andreas Rockstein/Flickr, CC BY-SA
But poisons often discourage seed destroyers and dispersers alike, so plants face a trade-off between deterring assailants and attracting the animals that safely disperse their seeds. Research so far suggests that how plants balance this trade-off depends on how long they hold onto fruit.
Highly nutritious and attractive fruit is quickly found and eaten as soon as it’s ripe: think of a plum tree stripped by fruit bats in a night or two. These fruits face less risk of damage before they’re safely eaten by the right animals, so protective toxins are less important and are therefore produced in lower quantities.
On the other hand, plants with less nutritious fruit, rarer or unreliable seed-dispersers, or more predators need to protect their vulnerable seeds with toxic fruit.
Finally, fruit might be poisonous simply because the rest of the plant is toxic. This is another trade-off some plants make: toxins that protect leaves from herbivores can also end up in the fruit.
Recent research suggests that poison fruit may ultimately result from adaptation to a range of animals consuming different plant parts, so we need to consider the whole plant and its interactions with various organisms to understand the origin and function of poison fruit.
Understanding how and why plants produce poison, in their fruit or elsewhere, has led to discoveries that are valuable for reasons other than murder and mayhem. Naturally occurring plant poisons have been used for a range of medical purposes from painkillers to antimalarial and anti-cancer agents, and there are potentially many more useful plant poisons yet to be discovered in the wild.
* Email your question to alwayswondered@theconversation.edu.au
* Tell us on Twitter by tagging @ConversationEDU with the hashtag #alwayswondered, or
* Tell us on Facebook
Julian MacPherson Brown does not work for, consult, own shares in or receive funding from any company or organisation that would benefit from this article, and has disclosed no relevant affiliations beyond the academic appointment above.
The new Great Barrier Reef pollution plan is better, but still not good enough
The draft water quality improvement plan, released by the federal and Queensland governments this week, aims to reduce the pollution flowing from water catchments to the Great Barrier Reef over the next five years.
It is part of the overarching Reef 2050 Long-Term Sustainability Plan to protect and manage the reef until mid-century.
Water quality is one of the biggest threats to the reef’s health, but the new guidelines still fall short of what’s required, given the available scientific evidence.
Read more: Cloudy issue: we need to fix the Barrier Reef’s murky waters.
The draft plan, which is open for comment until October, presents several important and commendable advances in the management of water quality on the Great Barrier Reef. It addresses all land-based sources of water pollution (agricultural, urban, public lands and industrial) and includes social, cultural and economic values for the first time.
The principal sources of pollution are nitrogen loss from fertiliser use on sugar cane lands, fine sediment loss from erosion on grazing lands, and pesticide losses from cropping lands. These are all major risk factors for the Great Barrier Reef.
The draft plan also presents updated water quality targets that call for reductions in run-off nutrients and fine sediments by 2025. Each of the 35 catchments that feeds onto the reef has its own individual set of targets, thus helping to prioritise pollution-reduction measures across a region almost as large as Sweden.
The reef’s still sufferingThe Great Barrier Reef suffered coral bleaching and death over vast areas in 2016, and again this year. The 2017 Scientific Consensus Statement, released with the draft water quality plan (and on which one of us, Jon Brodie, was an author), reports:
Key Great Barrier Reef ecosystems continue to be in poor condition. This is largely due to the collective impact of land run-off associated with past and ongoing catchment development, coastal development activities, extreme weather events and climate change impacts such as the 2016 and 2017 coral bleaching events.
Stronger action on the local and regional causes of coral death are seen to be essential for recovery at locations where poor water quality is a major cause of reef decline. These areas include mid-shelf reefs in the Wet Tropics region damaged by crown of thorns starfish, and inner-shelf reefs where turbid waters stop light reaching coral and seagrass. Human-driven threats, especially land-based pollution, must be effectively managed to reduce the impacts on the Great Barrier Reef.
But although the draft plan provides improved targets and a framework for reducing land-based pollution, it still doesn’t reflect the severity of the situation. The 2017 Scientific Consensus Statement reports that “current initiatives will not meet the water quality targets” by 2025.
This is because the draft plan does not provide any major new funding, legislation or other initiatives to drive down land-based pollution any further. As the statement explains:
To accelerate the change in on-ground management, improvements to governance, program design, delivery and evaluation systems are urgently needed. This will require greater incorporation of social and economic factors, better targeting and prioritisation, exploration of alternative management options and increased support and resources.
Read more: The Great Barrier Reef’s safety net is becoming more complex but less effective
The draft plan calls on farmers to go “beyond minimum standards” for practices such as fertiliser use in sugar cane, and minimum pasture cover in cattle grazing lands. But even the minimum standards are unlikely to be widely adopted unless governments implement existing legislation to enforce the current standards.
The draft plan is also silent on the impact of land clearing on water quality, and the conversion of grazing land to intensively farmed crops such as sugar cane, as proposed in the White Paper on Developing Northern Australia.
The federal and Queensland governments have committed A$2 billion over ten years to protect the Great Barrier Reef. Under the draft plan, about half of this (A$100 million a year) will be spent on water quality management. This is not an increase in resourcing, but rather the same level of funding that has been provided for the past seven years.
More than loose changeThere is a very strong business case for major increases in funding to protect the Great Barrier Reef. Even with conservative assumptions, the economics firm Jacobs has estimated that protecting the industries that depend on the reef will require A$830 million in annual funding – more than four times the current level.
Read more: What’s the economic value of the Great Barrier Reef? It’s priceless.
The draft water quality plan acknowledges the need for a “step change” in reef management, and to “accelerate our collective efforts to improve the land use practices of everyone living and working in the catchments adjacent to the Reef”.
This need is echoed in many other reports, both government and scientific. For example, the 2017 Scientific Consensus Statement makes several wide-ranging recommendations.
One of them is to make better use of existing legislation and policies, including both voluntary and regulatory approaches, to improve water quality standards.
This recommendation applies to both Commonwealth and Queensland laws. These include the federal Great Barrier Reef Marine Park Act 1975, which restricts or bans any activities that “may pollute water in a manner harmful to animals and plants in the Marine Park”, and the Environment Protection and Biodiversity Conservation Act 1999, which prohibits any action, inside or outside the marine park, that affects the Great Barrier Reef’s World Heritage values.
Another recommendation is to rethink existing land-use plans. For instance, even the best practice in sugar cane farming is inconsistent with the nitrogen fertiliser run-off limits needed to meet water quality guidelines. One option is to shift to less intensive land uses such as grazing in the Wet Tropics region – a priority area for nitrate fertiliser management because of its link to crown of thorns starfish outbreaks. This option is being explored in a NESP project.
These changes would require significantly increased funding to support catchment and coastal management and to meet the draft plan’s targets. Government commitment to this level of management is essential to support the resilience of the Great Barrier Reef to climate change.
Jon Brodie receives funding from the Australian Government; Queensland Government; UNEP; the Bay of Plenty Regional Council, NZ; Melbourne Water; NSW EPA. He was also an author of the 2017 Scientific Consensus Statement: Land Use Impacts on Great Barrier Reef Water Quality and Ecosystem Condition.
Laurence McCook is a Partner Investigator in the ARC Centre of Excellence for Coral Reef Studies.
Alana Grech does not work for, consult, own shares in or receive funding from any company or organisation that would benefit from this article, and has disclosed no relevant affiliations beyond the academic appointment above.