


The Conversation
Land clearing on the rise as legal 'thinning' proves far from clear-cut
 A 'thinned' landscape, which provides far from ideal habitat for many species. Author provided
Land clearing is accelerating across eastern Australia, despite our new research providing a clear warning of its impacts on the Great Barrier Reef, regional and global climate, and threatened native wildlife.
Policies in place to control land clearing have been wound back across all Australian states, with major consequences for our natural environment.
One of the recent policy changes made in Queensland and New South Wales has been the introduction of self-assessable codes that allow landholders to clear native vegetation without a permit. These codes are meant to allow small amounts of “low-risk” clearing, so that landholders save time and money and government can focus on regulating activities that have bigger potential impacts on the environment.
However, substantial areas of native forest are set to be cleared in Queensland under the guise of vegetation “thinning”, which is allowed by these self-assessable codes. How did this happen?
Thin on the groundThinning involves the selective removal of native trees and shrubs, and is widely used in the grazing industry to improve pasture quality. It has been argued that thinning returns the environment back to its “natural state” and provides better habitat for native wildlife. However, the science supporting this practice is not as clear-cut as it seems.
Vegetation “thickening” is part of a natural, dynamic ecological cycle. Australia’s climate is highly variable, so vegetation tends to grow more in wetter years and then dies off during drought years. These natural cycles of thickening and thinning can span 50 years or more. In most areas of inland eastern Australia, there is little evidence for ongoing vegetation thickening since pastoral settlement.
Thinning of vegetation using tractors, blades and other machinery interrupts this natural cycle, which can make post-drought recovery of native vegetation more difficult. Loss of tree and shrub cover puts native wildlife at much greater risk from introduced predators like cats, and aggressive, “despotic” native birds. Thinning reduces the diversity of wildlife by favouring a few highly dominant species that prefer open vegetation, and reduces the availability of old trees with hollows.
Many native birds and animals can only survive in vegetation that hasn’t been cleared for at least 30 years. So although vegetation of course grows back after clearing, for native wildlife it’s a matter of quality, not just quantity.
Land clearing by stealth?Thinning codes in Queensland and New South Wales allow landholders to clear vegetation that has thickened beyond its “natural state”. Yet there is little agreement on what the “natural state” is for many native vegetation communities.
Under the Queensland codes, up to 75% of vegetation in an area can be removed without a permit, and in New South Wales thinning can reduce tree density to a level that is too low to support natural ecosystems.
All of this thinning adds up. Since August 2016, the Queensland government has received self-assessable vegetation clearing code notifications totalling more than 260,000 hectares. These areas include habitat for threatened species, and ecosystems that have already been extensively cleared.
It may be that the actual amount of vegetation cleared under thinning codes is less than the notifications suggest. But we will only know for sure when the next report on land clearing is released, and by then it will be too late.
Getting the balance rightVegetation policy needs to strike a balance between protecting the environment and enabling landholders to manage their businesses efficiently and sustainably. While self-regulation makes sense for some small-scale activities, the current thinning codes allow large areas of vegetation to be removed from high-risk areas without government oversight.
Thinning codes should only allow vegetation to be cleared in areas that are not mapped as habitat for threatened species or ecosystems, and not to an extent where only scattered trees are left standing in a landscape. Stronger regulation is still needed to reduce the rate of land clearing, which in Queensland is now the highest in a decade.
Protecting native vegetation on private land reduces soil erosion and soil salinity, improves water quality, regulates climate, and allows Australia’s unique plants and animals to survive. Landholders who preserve native vegetation alongside farming provide essential services to the Australian community, and should be rewarded. We need long-term incentives to allow landholders to profit from protecting vegetation instead of clearing it.
Our research has shown that Australian governments spend billions of dollars trying to achieve the benefits already provided by native vegetation, through programs such as the Emissions Reduction Fund, the 20 Million Trees program and Reef Rescue. Yet far more damage is inflicted by under-regulated clearing than is “fixed” by these programs.
Imagine what could be achieved if we spent that money more effectively.
April Reside receives funding from NESP Threatened Species Recovery Hub. She sits on the Black-throated Finch Recovery Team and Birdlife Australia's Research and Conservation Committee.
Anita J Cosgrove receives funding from the Australian Research Council. She is a member of the Black-throated Finch Recovery Team, BirdLife Australia and the Australian Conservation Foundation.
Jennifer Lesley Silcock receives funding from the NESP Threatened Species Hub at the University of Queensland.
Leonie Seabrook receives funding from the Australian Research Council.
Megan C Evans receives funding from the National Environmental Research Programme Threatened Species Recovery Hub.
We need our country; our country needs us
 The sun rises above Uluru in outback Australia. David Gray/Reuters
 Increasingly, our leaders talk of Australian values and presume that these arose organically, as though through some moral forge. An alternative view is that our national character and sense of identity have been shaped mostly by the land itself: we are a nation of individualistic, resilient and resourceful individuals because our land is isolated, expansive, capricious and unique.
Our country’s dust, drought, flood, blood and harsh beauty have made us what we are.
In a report published today, the Pew Charitable Trust compiled a series of perspectives on how people living in remote and rural Australia see their lives and country. We interviewed about 12 groups over the course of a year, trying to understand the intricate relationships between our people and our nature.
The core questions addressed in these accounts are simple. How do we see our land? How do we live in it? How do we care for it? How are we shaped by it? What do we value in it, or seek from it? And to what extent does the land now need us?
The responses were intriguing. For many Indigenous Australians, country is a defining feature, a place of belonging, imbued over countless generations with meaning and spiritual significance. For many other Australians living in remote regions, country still provides an embracing sense of place, a setting in which life can be meaningful.
“This place is where I feel safe and inspired and needed,” conservation manager Luke Bayley said of Charles Darwin Reserve. “I love the landscape – the big sky, the weathered rocks and the harshness; the beauty when it all comes together […] I also find it an endless journey.”
Although they may want different things from the land, miners, pastoralists, Aboriginal landowners, wildlife rangers and tourism operators all share some pivotal values, concerns and language.
All seek to treasure and maintain its productivity and health; all recognise the new threats that may be subverting it; all feel a sense of belonging and a responsibility to it; all appreciate the need to know how it works in order to draw benefit and sustenance from it; all see beauty and wonder in at least some of its constituent elements; all recognise the challenge of managing vast lands with few people; and, to some degree, all understand a mutual dependency between land and people.
This common ground provides a robust foundation for the collaboration and regional - or national - scale planning needed for the management of Outback Australia, with its unique challenges of complex environmental linkages across vast distances, pervasive threats and few management resources.
But the nuanced differences in perspectives are also important. Many living in Outback Australia identify strongly with other groups living on the land. But there is much scope – so far little developed – in remote Australia for increased recognition of the perspectives and expertise of others.
Most notably, there is extraordinary opportunity to bring together the intimate knowledge of country and its care held by Indigenous Australians with the often complementary strengths of land management based on western science. We can create distinctively Australian environmental management, based on intimate knowledge of country and the capacity to respond to its new threats.
 A previous Pew study mapped the ‘Outback’ based on factors like low population density and infertile soil, and found it covered 73% of Australia.
Pew Charitable Trust, The Modern Outback (2014)
A previous Pew study mapped the ‘Outback’ based on factors like low population density and infertile soil, and found it covered 73% of Australia.
Pew Charitable Trust, The Modern Outback (2014)
Of course, there are also some notable inconsistencies among the perspectives we investigated, indicative of unresolved issues that need attention and a better process for conciliation or mutual understanding. For example, the values attributed to dingoes and wild dogs, and hence their management, remain highly polarised among people living in remote Australia. The elements of water and fire are pivotal in the Outback, and their use is often also contested.
Furthermore, just as our society has been moulded by our country, increasingly we are re-shaping the country, deliberately or inadvertently, expertly or ineptly. Across most of the world, biodiversity is in decline particularly in areas with high human population density and extensive habitat destruction.
The Australian outback is one of the world’s few remaining large natural areas, along with places like the Amazon Basin and the Sahara. Such areas are most likely to long support functional and healthy ecological processes and biodiversity.
However, somewhat counterintuitively, in much of the Outback, nature is in decline even in its most remote and sparsely populated regions. This decline reflects the loss from many areas of a long-established, intricate and purposeful Indigenous land management, that has long moulded its nature. Now, fire is often managed inexpertly or not at all, leading to uncontrolled and destructive wildfire. And the decline of biodiversity and loss of productivity in remote Australia is due also to the extensive spread of many pests and weeds introduced over the last century or so, and the inadequate resources committed to their control.
Inexorably, we will lose much that is special in our nature unless we can collectively address these causal factors and manage our lands more effectively. The land managers we talked to are skilled and willing, but they need more support.
One example is Les Schultz, a Ngadju elder from the country around Norseman in south-western Australia. He told us he wants to see the Great Western Woodlands managed properly, saying,
We will always be around, and it ticks all the boxes of everything good in terms of outcomes for Ngadju people and the general community …. We need Ngadju rangers with boots on the ground.
A similar call comes from some pastoralists, such as Michael Clinch from the Murchison region of WA. He inherited a land long over-exploited by unsustainable levels of grazing, and is now seeking new management approaches to to take his land on “a journey of redemption”:
The Outback, to me, is the cathedral of Australia. We’re desperate to reclaim the quality and value of the Outback, and to achieve that vision we need support … We’re not asking for a handout, but by jeez we’re asking for a hand up. We need assistance to rebuild and restructure our grazing. If we don’t do it, who the hell will?
The accounts showcase people at home in their country. Such accounts, of characters living in the bush, have long been emblematic for our nation. But these lives represent a diminishing minority of Australians.
In our increasingly urbanised society, for much of our nation’s population, the bush remains quixotic and unfamiliar, to be experienced superficially or fearfully. One objective of this collation is to allow urban Australians to see and feel the country through the eyes and hearts of those who are immersed in it.
We would like all Australians to more appreciate the care bestowed on our land by those who cherish it, the benefits we all derive from that care, and the need to better support those who seek to maintain our natural legacy.
We cannot live well in this land unless we understand it, and value it.
This article is based on Outback Voices, a report compiled by the Pew Charitable Trusts.
John Woinarski worked with Pew Charitable Trusts to contribute to a series on Outback Australia. He is currently a deputy director of the Threatened Species Recovery Hub, funded by the Australian government's National Environmental Science Programme.
Are heatwaves 'worsening' and have 'hot days' doubled in Australia in the last 50 years?
The release of the Finkel report has refocused national attention on climate change, and how we know it’s happening.
On a Q&A episode following the report’s release, Climate Council CEO Amanda McKenzie said we’ve seen:
… worsening heatwaves, hot days doubling in Australia in the last 50 years.
Excerpt from Q&A, June 12, 2017. Quote begins at 2:12.Her comment provides the perfect opportunity to revisit exactly what the research says on heatwaves and hot days as Australia’s climate warms.
Examining the evidenceWhen asked for sources to support McKenzie’s assertion, a Climate Council spokesperson said:
Climate change is making hot days and heatwaves more frequent and more severe. Since 1950 the annual number of record hot days across Australia has more than doubled and the mean temperature has increased by about 1°C from 1910.
Specifically, there has been an increase of 0.2 days/year since 1957 which means, on average, that there are almost 12 more days per year over 35°C.
You can read full response from the Climate Council here.
How do we define ‘heatwaves’?Internationally, organisations use different definitions for heatwaves.
In Australia, the most commonly used definition (and the one used by the Climate Council) is from the Bureau of Meteorology (BOM). It provided the first national definition of a heatwave in January 2014, describing it as:
A period of at least three days where the combined effect of excess heat and heat stress is unusual with respect to the local climate. Both maximum and minimum temperatures are used in this assessment.
The BOM uses a metric called the “excess heat factor” to decide what heat is “unusual”. It combines the average temperature over three days with the average temperature for a given location and time of year; and how the three day average temperature compares to temperatures over the last 30 days.
We can also characterise heatwaves by looking at their their intensity, frequency and duration.
Researchers, including Australian climate scientist Dr Sarah Perkins-Kirkpatrick, are trying to standardise the definitions of “heatwaves” and “hot days” and create a framework that allows for more in-depth studies of these events.
Are heatwaves ‘worsening’?There’s not a large body of research against which to test this claim. But the research we do have suggests there has been an observable increase in the frequency and intensity of heatwaves in Australia. Research published in 2013 found a trend towards more heat waves in Australia between 1951 and 2008.
A review paper published in 2016 assessed evidence from multiple studies and found that heatwaves are becoming more intense and more frequent for the majority of Australia.
The following chart shows heatwave days per decade from 1950 to 2013, highlighting a trend toward more heatwave days in Australia over time:
 We’ve seen a trend towards more heatwave days over Australia. Trends are shown for 1950-2013 in units of heatwave days per decade. Stippling indicates statistical significance at the 5% level.
Adapted from Perkins-Kirkpatrick et al. (2017)
Have hot days ‘doubled’ in the last 50 years?
We’ve seen a trend towards more heatwave days over Australia. Trends are shown for 1950-2013 in units of heatwave days per decade. Stippling indicates statistical significance at the 5% level.
Adapted from Perkins-Kirkpatrick et al. (2017)
Have hot days ‘doubled’ in the last 50 years?
While the number of “hot days” (as defined by the BOM) has not doubled over the last 50 years, as McKenzie said, the number of “record hot days” certainly has. “Record hot days” are days when the maximum temperature sets a new record high.
Given that McKenzie made her statement on a fast paced live TV show, it’s reasonable to assume she was referring to the latter. Let’s look at both figures.
The BOM defines “hot days” as days with a maximum temperature higher than 35°C. The BOM data show there were more hot days in Australia in 2013, 2014, 2015 and 2016 than in any of the 50 years from 1966 to 2016 (the last year for which data are available).
In fact, there were more hot days in the years 2013-2016 than in any other year as far back as 1910. If we compare the decades 1966-76 and 2006-16, we see a 27% increase in the number of hot days.
The following map shows the trend in the number of days per year above 35 °C from 1957–2015:
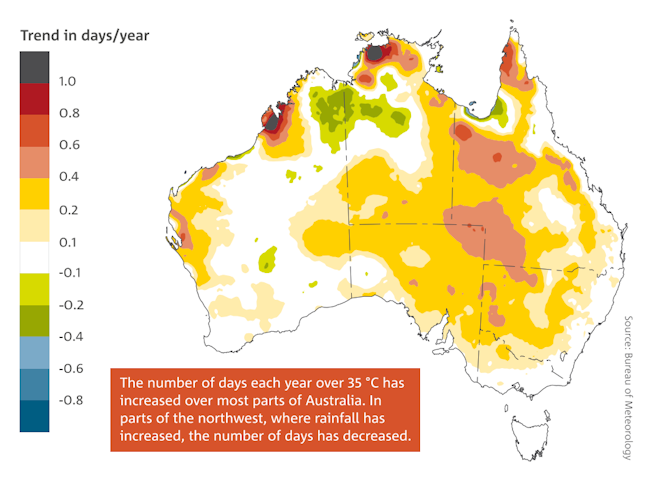 Bureau of Meteorology
A 2010 Bureau of Meteorology/CSIRO report found record hot days had more than doubled between 1960 and 2010. That data was collected from the highest-quality weather stations across Australia.
 Number of record hot day maximums at Australian climate reference stations, 1960-2010.
Bureau of Meteorology 2010
Number of record hot day maximums at Australian climate reference stations, 1960-2010.
Bureau of Meteorology 2010
 Number of days in each year where the Australian area-averaged daily mean temperature is extreme. Extreme days are those above the 99th percentile of each month from the years 1910-2015.
Bureau of Meteorology
Why are heatwaves worsening, and record hot days doubling?
Number of days in each year where the Australian area-averaged daily mean temperature is extreme. Extreme days are those above the 99th percentile of each month from the years 1910-2015.
Bureau of Meteorology
Why are heatwaves worsening, and record hot days doubling?
The trend in rising average temperatures in Australia in the second half of the 20th century is likely to have been largely caused by human-induced climate change.
Recent record hot summers and significant heatwaves were also made much more likely by humans’ effect on the climate.
The human influence on Australian summer temperatures has increased and we can expect more frequent hot summers and heatwaves as the Earth continues to warm.
Andrew King receives funding from the ARC Centre of Excellence for Climate System Science.
Full response from the Climate Council for an article on heatwaves and hot days in Australia
 Climate Council CEO Amanda McKenzie, speaking on Q&A. Q&A
In relation to this article responding to Climate Council CEO Amanda McKenzie’s claim that heatwaves are “worsening” and “hot days” have doubled in Australia in the last 50 years, a spokesperson for the Climate Council gave the following responses. Questions from The Conversation are in bold.
Could you please provide a source, or sources, to support Ms McKenzie’s statement that heatwaves are “worsening” and hot days have doubled in the last 50 years?
Climate change is making hot days and heatwaves more frequent and more severe. Since 1950 the annual number of record hot days across Australia has more than doubled and the mean temperature has increased by about 1°C from 1910.
Specifically, there has been an increase of 0.2 days/year since 1957 which means, on average, that there are almost 12 more days per year over 35°C.
What did Ms McKenzie mean by the terms “heatwaves” and “hot days”?
Hot days – the number of hot days, defined as days with maximum temperatures greater than 35°C.
Heatwaves – three days or more of high maximum and minimum temperatures that is unusual for that location.
Furthermore, heatwaves have several significant characteristics. These include (i) frequency characteristics, such as the number of heatwave days and the annual number of summer heatwave events; (ii) duration characteristics, such as the length of the longest heatwave in a season; (iii) intensity characteristics, such as the average excess temperature expected during a heatwave and the hottest day of a heatwave; and (iv) timing characteristics, including the occurrence of the first heatwave event in a season.
Is there any other comment you would like us to include in the article?
Climate change – driven largely by rising atmospheric carbon dioxide concentrations from the burning of coal, oil and gas – is increasing temperatures and cranking up the intensity of extreme weather events globally and in Australia.
The accumulating energy in the atmosphere is affecting all extreme weather events. Climate change is driving global warming at a rate 170 times faster than the baseline rate over the past 7,000 years.
Temperature records tumbled yet again during Australia’s ‘Angry Summer’ of 2016/17. In just 90 days, more than 205 records were broken around Australia.
Heatwaves and hot days scorched the major population centres of Adelaide, Brisbane, Canberra, Melbourne and Sydney, as well as the rural and regional heartlands of eastern Australia. The most severe heatwave of this Angry Summer began around January 31 and continued until February 12, with the highest temperatures recorded from February 9-12.
This heatwave was made twice as likely to occur because of climate change, while the extreme heat in New South Wales over the entire summer season was at least 50 times as likely to occur because of climate change.
The severe heatwave of February 2017 that spread across much of Australia’s south, east and interior caused issues for the South Australian and New South Wales energy systems. In New South Wales around 3,000MW of coal and gas capacity was not available when needed in the heatwave (roughly the equivalent of two Hazelwood Power Stations).
In South Australia, 40,000 people were left without power for about half an hour in the early evening while temperatures were over 40°C. This heatwave highlights the vulnerability of our energy systems to extreme weather.
Read the article here.
The last line of defence: Indigenous rights and Adani's land deal
 Members of the W&J Traditional Owners Council outside the Federal Court. W&J Council
The Wangan and Jagalingou Traditional Owners Family Council (W&J) is involved in a remarkable struggle to assert their Indigenous rights in opposition to the proposed Adani Carmichael coal mine. Despite the company’s board-level decision to proceed, the mine has not cleared all legal hurdles.
W&J’s efforts – recognised globally as a leading Indigenous rights campaign – are challenging Australia’s native title system, and the notion that compliance with industrial projects is the pathway to development for Indigenous people.
The W&J struggle has largely focused on contesting Adani’s efforts to secure an Indigenous Land Use Agreement (Ilua) – the consent of the traditional owners for the mine to proceed. The Ilua would let Adani undertake all works associated with the project, and secure a 2,750 hectare area for critical infrastructure related to mine operations, including an airstrip, workers village, and washing plant.
While the National Native Title Tribunal authorised the Queensland Government to approve the mining leases for Adani in 2016 without the consent of the W&J, this is subject to ongoing legal challenge. Without an Ilua, there is no legal basis to build the infrastructure. In this scenario, the only option would be the compulsory acquisition of land by the state – an unprecedented move in the history of native title that would privilege mining interests above the wishes of traditional owners.
We are undertaking a research project in collaboration with the W&J and Australian Lawyers for Human Rights. The W&J have provided us with access to their files, and we have conducted preliminary analysis of the political, social and economic context of their campaign.
Changing the rulesEarlier this week both houses of Parliament passed amendments to annul the effects of a February 2017 Federal Court full bench decision that confirmed the Native Title Act required all registered native title claimants to sign an Ilua. This overturned a previous decision made by a single judge, which allowed that one signature was sufficient, as long as an Ilua had been approved by the claim group.
The W&J had moved quickly, on the basis of the court decision, to have Adani’s claimed deal struck out. But the Federal Government moved swiftly too, less than two weeks later placing amendments before Parliament that removed the W&J Council’s option to annul.
These amendments, while validating existing Iluas that could have been brought into question, are also widely acknowledged as a fix for Adani. In April, Prime Minister Malcolm Turnbull reassured senior Adani executives in India that the native title situation would be fixed.
However, the future of the Ilua and Adani’s mine is far from secure. W&J legal action challenging Adani’s Ilua process on several grounds is set for hearing in the Federal Court in March 2018.
The Shadow Attorney-General Mark Dreyfus has affirmed the question mark over the agreement, saying:
It is not my understanding that this bill will provide some kind of removal of a final legal hurdle for the Adani mine […] they [the W&J] have made clear that there are some very serious allegations of fraud that have been made against Adani.
In a further recent twist, Wangan and Jagalingou representative Craig Dallen, who previously signed Adani’s Ilua documents, has withdrawn his support in an affidavit. He’s also raised doubts about the meeting processes that were used to construct the deal.
In evidence submitted to the Federal Court, the W&J argue the attendance record at the meeting organised and paid for by Adani shows that many attendees were not present at prior native title group authorisation meetings, and are not Wangan and Jagalingou claimants.
The lure of IluasIluas are very hard for Indigenous people to resist. The native title regime provides very limited protection, such that Indigenous people are often forced to take a poor Ilua deal, rather than risk ending up with nothing at the National Native Title Tribunal.
While Adani has filed for registration of an Ilua, the W&J calls it a “sham”, asserting that the Wangan and Jagalingou people have rejected a deal with Adani on three separate occasions since 2012.
The limitations of Iluas for Indigenous people partly arise because native title is a highly contingent and weak form of title. It does not apply where Indigenous observance of custom has been disrupted. However the colonial pattern of frontier violence and policies such as assimilation sought, by design, to directly eliminate custom.
Native title can also be extinguished, and can only be claimed in certain areas where other legal title (such as freehold) does not exist. Rights granted under native title are also typically non-exclusive, giving little opportunity to control access to land or its use.
While the W&J are making use of the legal avenues available to them through the native title process, they are also asserting their rights apart from it. Their legal strategy is a rejection of what they see as a constrained native title system, in which Indigenous peoples’ agreement or acquiescence to mining is the norm.
Instead, the W&J are part of a growing international Indigenous rights movement that firmly centres Indigenous peoples’ interests in struggles for restitution and a sustainable future for their people. They stand on their right to free, prior and informed consent, reflected in the United Nations Declaration on the Rights of Indigenous People.
More fundamentally, though, the W&J stress that they are custodians of country, and are acting in accordance with Aboriginal law in their resistance to the Carmichael mine. This is contrary to Marcia Langton’s recent assertion that opposition to Adani’s mine is driven by a minority of Indigenous people at the behest of the greens.
This article is based upon a recently released report, Unfinished Business: Adani, the State, and the Indigenous Rights Struggle of the Wangan and Jagalingou Traditional Owners Council.
Morgan Brigg receives funding from through the Global Change Institute’s Flagship Program at The University of Queensland.
John Quiggin receives funding from the Global Change Institute’s Flagship Program at The University of Queensland. He is a consultant for Farmers for Climate Action and has worked for other environmental organisations on a voluntary basis. He has received funding from the Australian Research Council, and was formerly a Member of the Climate Change Authority
Kristen Lyons receives funding from the Global Change Institute’s Flagship Program at The University of Queensland. She is a research fellow with the Oakland Institute and is a member of the Australian Greens.
Only a mother could love 'em: why cockroaches and termites are great parents
 Giant northern cockroaches are surprisingly caring parents. Urasimaru/Wikimedia Commons, CC BY-SA
To most people, cockroaches are abhorrent, disease-ridden pests, scuttling under the fridge when you go to the kitchen for a midnight snack. But those who know cockroaches well understand that they can be very caring creatures.
There are about 5,000 named cockroaches, and in a small minority of species mothers look after their babies (nymphs), and feed and care for them in a protective burrow. A good example is the Australian giant burrowing cockroach (Macropanesthia rhinoceros), which lives mainly in northern Queensland.
Around 20 baby cockroaches live with their mother for 5-6 months, and she drags leaves collected from the soil surface down into the burrow for food. If you’re so inclined, you can buy a pair of adult giant burrowing cockroaches as pets for around A$150.00, and see their maternal behaviour for yourself.
 Macropanesthia rhinoceros, Frantisek Vecernik.
Pinterest
Macropanesthia rhinoceros, Frantisek Vecernik.
Pinterest
Some cockroach mothers are even more caring, with elaborate parenting behaviours to look after their babies. The mother wood-burrowing cockroach (Cryptocercus) from North America lays its eggs in a nest formed in a rotting log.
Mum and dad wood roach then live in the nest with 20 or so nymphs for three years or more. The parents defend, extend and clean the gallery, feeding the young by regurgitating food (much like many birds do) and with specialised fluids produced by glands in their gut. The babies return the favour, spending almost 10% of their time grooming the adults.
These cockroaches have an unusual diet: they digest the cellulose in wood with the help of specialised gut microbes. The nymphs don’t have these microbes when they are born, but obtain them by feeding on the regurgitated contents of their parents’ stomachs. Eventually the teenage cockroaches leave the parental nest to form their own nests.
 Cryptocercus adult (dark brown) and nymph (light brown) from the eastern US.
David Maddison
Cryptocercus adult (dark brown) and nymph (light brown) from the eastern US.
David Maddison
Until recently, maternal care in cockroaches was considered an evolutionary oddity. A few other insect groups have similar behaviour, but it was considered to be just one of a range of (often bizarre) strategies that insects have evolved to increase the survival chances of their offspring.
However, as our understanding of insect relationships has increased in recent years, maternal care in cockroaches is now seen not as a strange evolutionary dead end, but an important stepping stone in the development of the huge, complex and well-ordered societies formed by other insect species. This realisation is partly down to the fact that we now know termites evolved from cockroaches. This was first discovered in 2000 by a team led by a laboratory at the University of Sydney, and has been confirmed numerous times since then.
Termite timeTermites are known as Isoptera to entomologists – and never as “white ants” because termites bear no close relation to true ants at all.
As it happens, some of the earliest-evolved groups of termites live in Australia. The giant northern termite (Mastotermes darwiniensis) is found only in Australia, north of the tropic of Capricorn. They show similar maternal care to the wood roach in north America, but have extended this behaviour even further.
These termites live in colonies that number in the thousands or millions. At the centre of the colony is a mother (queen), and father (king), and these are responsible for reproduction. A queen giant termite can lay millions of eggs in its lifetime? and live for decades. Giant northern termites live in a nest underground, or inside rotting wood, and because they almost never see the sunshine they have become pale (hence the erroneous term “white ant”).
However small and pale, these termites can be a major agricultural pest in northern Australia because they consume almost anything organic, including living and dead plants, and trees, rubber, leather - even plastic. They digest cellulose from plant material using specialised gut microbes, much like wood roaches do.
 Giant northern termite, Mastotermes darwiniensis, worker caste.
scienceimage.csiro.au
Giant northern termite, Mastotermes darwiniensis, worker caste.
scienceimage.csiro.au
How do giant northern termite colonies containing thousands or millions of individuals differ from the 20 nymphs of the wood roach? The first and most obvious difference is that the termite colony contains several types of individuals: the reproductive kings and queens; the soldiers who defend the nest; and the workers who clean and excavate the next, carry out running repairs, and gather food.
These different types (castes) have different anatomies, each tailored to their job. In contrast, all wood roaches look the same, and the nymphs leave the parental nest, find a partner and begin their own little families.
The second major difference is that the king and queen termite outlive their children (the soldiers and workers) many times over, and as a result their offspring never leave home. This in turn begs the question: what makes the workers and soldiers forego reproduction and spend all their lives in the colony?
The king and queen produce biological signalling chemicals called pheromones, which are transferred to the workers that feed on the king and queen’s excretions. In essence, the parents are feeding their young a chemical that makes them stay at home and help mum and dad with the housework.
This is a neat, self-regulating system: if mum or dad dies, the chemical isn’t produced and some of the youngsters begin reproducing for themselves.
It is unusual for any animal to surrender the opportunity to propagate its own genes, and there must be a very good evolutionary reason for it. Highly cooperative behaviour is thought to develop when the benefits of living together outweigh the benefits of building or finding your own nest.
Perhaps we can even think of termites as cockroaches that love their babies a little bit too much.
David Yeates receives funding from CSIRO, The Australian Biological Resources Study, the US National Science Foundation, and holds the Schlinger endowed research position at the Australian National Insect Collection.
Volcanoes under the ice: melting Antarctic ice could fight climate change
 Furious winds keep the McMurdo Dry Valleys in Anarctica free of snow and ice. Calcites found in the valleys have revealed the secrets of ancient subglacial volcanoes. Stuart Rankin/Flickr, CC BY-NC
Iron is not commonly famous for its role as a micronutrient for tiny organisms dwelling in the cold waters of polar oceans. But iron feeds plankton, which in turn hold carbon dioxide in their bodies. When they die, the creatures sink to the bottom of the sea, safely storing that carbon.
How exactly the iron gets to the Southern Ocean is hotly debated, but we do know that during the last ice age huge amounts of carbon were stored at the bottom of the Southern Ocean. Understanding how carbon comes to be stored in the depth of the oceans could help abate CO2 in the atmosphere, and Antarctica has a powerful role.
Icebergs and atmospheric dust are believed to have been the major sources of this micronutrient in the past. However, in research published in Nature Communications, my colleagues and I examined calcite crusts from Antarctica, and found that volcanoes under its glaciers were vital in delivering iron to the ocean during the last ice age.
Today, glacial meltwaters from Greenland and the Antarctic peninsula supply iron both in solution and as tiny particles (less than 0.0001mm in diameter), which are readily consumed by plankton. Where glaciers meet bedrock, minute organisms can live in pockets of relatively warm water. They are able to extract “food” from the rock, and in doing so release iron, which then can be carried by underwater rivers to the sea.
Volcanic eruptions under the ice can create underwater subglacial lakes, which, at times, discharge downstream large masses of water that travel to the ice margin and beyond, carrying with them iron in particle and in solution.
The role of melting ice in climate change is as yet poorly understood. It’s particularly pertinent as scientists predict the imminent collapse of part of the Larsen C ice shelf.
Researchers are also investigating how to reproduce natural iron fertilisation in the Southern Ocean and induce algal blooms. By interrogating the volcanic archive, we learn more about the effect that iron fertilisation from meltwater has on global temperatures.
 A polished wafer of the subglacial calcites. The translucent, crystalline layers formed while in pockets of water, providing nourishment to microbes. The opaque calcite with rock fragments documents a period when waters discharged from a subglacial lake formed by a volcanic eruption, carrying away both iron in solution and particles of iron.
Supplied
The Last Glacial Maximum
A polished wafer of the subglacial calcites. The translucent, crystalline layers formed while in pockets of water, providing nourishment to microbes. The opaque calcite with rock fragments documents a period when waters discharged from a subglacial lake formed by a volcanic eruption, carrying away both iron in solution and particles of iron.
Supplied
The Last Glacial Maximum
During the Last Glacial Maximum, a period 27,000 to 17,000 years ago when glaciers were at their greatest extent worldwide, the amount of CO2 in the atmosphere was lowered to 180 parts per million (ppm) relative to pre-industrial levels (280 ppm).
Today we are at 400 ppm and, if current warming trends continue, a point of no return will be reached. The global temperature system will return to the age of the dinosaurs, when there was little difference in temperature from the equator to the tropics.
If we are interested in providing a habitable planet for our descendants, we need to mitigate the quantity of carbon in the atmosphere. Blooms of plankton in the Southern Ocean boosted by iron fertilisation were one important ingredient in lowering CO2 in the Last Glacial Maximum, and they could help us today.
The Last Glacial Maximum had winds that spread dust from deserts and icebergs carrying small particles into the Southern Ocean, providing the necessary iron for algal blooms. These extreme conditions don’t exist today.
Hidden volcanoesNeither dust nor icebergs alone, however, explain bursts of productivity recorded in ocean sediments in the Last Glacial Maximum. There was another ingredient, only discovered in rare archives of subglacial processes that could be precisely dated to the Last Glacial Maximum.
Loss of ice in Antartica’s Dry Valleys uncovered rusty-red crusts of calcite plastered on glacially polished rocks. The calcites have tiny layers that can be precisely dated by radiometric techniques.
 A piece of subglacial calcite coating pebbles. This suggests that the current transporting the pebbles was quite fast, like a mountain stream. The pebbles were deposited at the same time as the opaque layer in the calcite formed.
Supplied
A piece of subglacial calcite coating pebbles. This suggests that the current transporting the pebbles was quite fast, like a mountain stream. The pebbles were deposited at the same time as the opaque layer in the calcite formed.
Supplied
Each layer preserves in its chemistry and DNA a record of processes that contributed to delivering iron to the Southern Ocean. For example, fluorine-rich spherules indicate that underwater vents created by volcanic activity injected a rich mixture of minerals into the subglacial environment. This was confirmed by DNA data, revealing a thriving community of thermophiles – microorganisms that live in very hot water only.
Then, it became plausible to hypothesise that volcanic eruptions occurred subglacially and formed a subglacial lake, whose waters ran into an interconnected system of channels, ultimately reaching the ice margin. Meltwater drained iron from pockets created where ice met bedrock, which then reached the ocean – thus inducing algal blooms.
We dated this drainage activity to a period when dust flux does not match ocean productivity. Thus, our study indicates that volcanoes in Antarctica had a role in delivering iron to the Southern Ocean, and potentially contributed to lowering CO2 levels in the atmosphere.
Our research helps explain how volcanoes act on climate change. But it also uncovers more about iron fertilisation as a possible way to mitigate global warming.
Silvia Frisia receives funding from ARC.
Politics podcast: Josh Frydenberg, George Christensen and Mark Butler on the Finkel review
 Lukas Coch/AAP
Malcolm Turnbull declared on Wednesday he’d “provided decisive leadership on energy”. It is a claim perhaps better cast in the future tense.
The debate over the Finkel panel’s recommendation for a clean energy target (CET) is just beginning, and already it is clear that reaching an outcome that brings the certainty the business community needs to invest will be a hard slog for Turnbull, who will be undermined by critics on his own side.
In this podcast we talk Finkel with Energy Minister Josh Frydenberg, Nationals backbencher George Christensen, and opposition climate spokesman Mark Butler.
Frydenberg, charged with the detailed heavy-lifting, tells Michelle Grattan: “We have to work together as a team to land this difficult policy area.”
Christensen proudly wears the agrarian socialist title as he advocates for radical changes to the regulation of Australian energy prices. “Being bold is the answer and market intervention has to happen.” He’s sceptical of a CET without seeing the modelling and data.
Butler believes a CET is workable but it has to be consistent with principles, which means such a scheme shouldn’t incorporate so-called “clean” coal. “The discussion of the Finkel report shouldn’t include concessions for the hard-right-wing,” he says.
Michelle Grattan does not work for, consult, own shares in or receive funding from any company or organization that would benefit from this article, and has disclosed no relevant affiliations beyond the academic appointment above.
Zoos aren't Victorian-era throwbacks: they're important in saving species
 A meerkat at the National Zoo and Aquarium in Canberra. The Zoo has recently announced an expansion that will double its size. AAP Image/Stefan Postles
The National Zoo and Aquarium in Canberra recently announced a new expansion that will double its size, with open range space for large animals like white rhinos and cheetahs.
As well as improving visitors’ experience, the expansion is touted as a way to improve the zoo’s breeding program for threatened animals. However, zoos have received plenty of criticism over their capacity to educate, conserve, or even keep animals alive.
But while zoos began as 19th-century menageries, they’ve come a long way since then. They’re responsible for saving 10 iconic species worldwide. Without captive breeding and reintroduction efforts, there might be no Californian Condor or Przewalski’s Horse – the only truly wild horse – left in the wild.
Australian zoos form part of a vital global network that keeps our most vulnerable species alive.
What is the role of zoos for conservation?Although Canberra Zoo is relatively new compared with others in Australia – Melbourne zoo, for example, was opened in 1862 – it adds to a collection of conservation-orientated establishments.
In Australia, Taronga Conservation Society Australia, the Royal Melbourne Zoological Gardens, Adelaide Zoo and Perth Zoo are all members of the World Association of Zoos and Aquariums (WAZA). WAZA is an international organisation that aims to guide and support zoos in their conservation missions, including captive breeding, reintroductions into the wild, habitat restoration, and genetic management.
From the perspective of nature conservation, zoos have two major roles: educating the public about the plight of our fauna, and contributing to species recovery in the wild.
Conservation education is deeply embedded in the values of many zoos, especially in Australia. The evidence for the link between zoo education and conservation outcomes is mixed, however zoos are, above anybody else, aimed at children. Evidence shows that after guided experiences in zoos children know more about nature and are more likely to have a positive attitude towards it. Importantly, this attitude is transferable to their parents.
Zoos contribute unique knowledge and research to support field conservation programs, and thus species recovery. In Australia, zoos are directly involved in monitoring of free-ranging native fauna and investigations into emerging diseases. Without zoos many fundamental questions about a species’ biology could not be answered, and we would lack essential knowledge on animal handling, husbandry and care.
Through captive breeding, zoos can secure healthy animals that can be introduced to old or new habitats, or bolster existing wild populations. For example, a conservation manager at Taronga Zoo told me they’ve released more than 50,000 animals that were either bred on-site or rehabilitated in their wildlife hospitals (another important function of zoos).
Criticisms of captive breeding programsThe critics of captive breeding as a conservation strategy raise several concerns. Captive bred population can lose essential behavioural and cultural adaptations, as well as genetic diversity. Large predators – cats, bears and wolves – are more likely to be affected.
Some species, such as frogs, do well in captivity, breed fast, and are able to be released into nature with limited or no training. For others, there is usually a concerted effort to maintain wild behaviour.
There’s a higher chance of disease wiping out zoo populations due to animal proximity. In 2004 the largest tiger zoo in Thailand experienced an outbreak of H5N1 bird flu after 16 tigers were fed contaminated raw chicken; ultimately 147 tigers died or were put down.
However, despite these risks, research shows that reintroduction campaigns improve the prospects of endangered species, and zoos can play a crucial role in conservation. Zoos are continually improving their management of the genetics, behaviour and epidemiology of captive populations.
They are the last resort for species on the brink of extinction, such as the Orange-bellied Parrot or the Scimitar-horned Oryx, and for those facing a threat that we cannot stop yet, such as amphibians threatened by the deadly Chytrid fungus.
 Orange-bellied parrots are ranked among the most endangered species on the planet – their survival depends on zoos.
Chris Tzaros/AAP
Zoos need clear priorities
Orange-bellied parrots are ranked among the most endangered species on the planet – their survival depends on zoos.
Chris Tzaros/AAP
Zoos need clear priorities
A cost-benefit approach can help zoos prioritise their actions. Taronga, for example, uses a prioritisation system to decide which projects to take on, with and without captive breeding. Their aim is to a foresee threats to wildlife and ecosystems and implement strategies that ensure sustainability.
Developing prioritisation systems relies on clearly defined objectives. Is there value in keeping a species in captivity indefinitely, perhaps focusing only on education? Is contributing to a wild population the end goal, requiring both education and active conservation?
Once this is defined, zoos can assess the benefit and costs of different actions, by asking sometimes difficult questions. Is a particular species declining in the wild? Can we secure a genetically diverse sample before it is too late? Will capturing animals impact the viability of the wild population? How likely is successful reintroduction? Can we provide enough space and stimulation for the animals, and how expensive are they to keep?
Decision science can help zoos navigate these many factors to identify the best species to target for active captive conservation. In Australia, some of the rapidly declining northern mammals, which currently do not have viable zoo populations, could be a good place to start.
Partnerships with governmental agencies, universities and other groups are essential to all of these activities. Zoos in Australia are experts at engaging with these groups to help answer and address wildlife issues.
Alienor Chauvenet would like to acknowledge the contribution of Hugh Possingham to this article, and thank Nick Boyle and Justine O’Brien from Taronga Conservation Society Australia for the information they provided.
Alienor Chauvenet does not work for, consult, own shares in or receive funding from any company or organisation that would benefit from this article, and has disclosed no relevant affiliations beyond the academic appointment above.
Cars overwhelmingly cause bike collisions, and the law should reflect that
On a Thursday morning in June 1817, the prolific inventor Karl Drais took his Laufmaschine (running machine) for a 13km spin along the banks of the Rhine.
The voyage on the wooden bike, not dissimilar to a modern toddler’s balance bike, lasted just under an hour. The early bicycle sparked an immediate craze, and later versions became a symbol of freedom for workers and women.
Two hundred years after their invention, bicycles are widely recognised as an effective tool to combat physical and mental health problems, reduce congestion on urban roads and improve the quality of the environment.
However, cycling participation across Australia is stagnating. This is mainly because of concerns about safety. A report released last week by the Royal Automobile Association of South Australia found that in the vast majority of crashes the cyclist was not at fault.
To keep our cyclists safe, it may be time to adopt the approach of many European nations by introducing legislation that, in civil cases, presumes that car drivers caused a collision unless there is evidence to the contrary.
Shifting the burden of proof to drivers – who must prove they didn’t cause a crash – has been highly successful in other nations, along with other measures, in keeping cyclists safer and reducing accidents.
 Karl Von Drais and his Laufmaschine.
© TECHNOSEUM
Cars generally cause collisions
Karl Von Drais and his Laufmaschine.
© TECHNOSEUM
Cars generally cause collisions
Despite a significant reduction in road deaths in Australia over the past few decades, recent data point to a steady increase in serious injuries among vulnerable road users, including cyclists.
Australia needs serious action if we want to reverse this trend. Last week’s report from the RAA confirms other research in this area, such as a 2013 University of Adelaide study that examined police crash records and found drivers caused four in every five crashes between cars and bicycles.
These results are similar to a Monash University study in which researchers examined camera footage of similar incidents. They found that drivers were responsible for the actions preceding the incident in 87% of cases.
The previous studies show that most of these crashes occur at intersections, and generally involve a cyclist travelling in a straight line on a single carriageway at the time of the collision with the motor vehicle.
The presumption of liabilityPrevious road safety lessons, like the successful seatbelt campaign, tell us education and infrastructure only work in combination with strong regulations. However, legislation in the area of cycling safety is inadequate and puts an unfair burden on cyclists.
Under current laws, if a car collides with a bicycle or a pedestrian on Australian roads, they must make a case against the motorist to claim on the motorist’s insurance. If the insurance company contests the claim, the injured cyclist or pedestrian has to take the case to a civil court.
Surely the burden of proof should shift onto the more powerful road user, especially given that the research suggests they are more likely to be the one at fault.
To do so, we need a presumed liability law that protects vulnerable road users. Similar laws have been introduced in Canada and in many European countries, including the Netherlands, Germany, Denmark and France. Under these laws, sometimes also referred to as “reverse onus” or “strict liability” laws, drivers must prove that a collision with a cyclist or a pedestrian was not their fault.
These laws affect civil cases only and do not remove the presumption of innocence. In criminal law, drivers in collisions with vulnerable road users remain innocent until proven guilty. It’s also not about always blaming motorists; for example, if a cyclist ran a red light and caused a collision, they would obviously be at fault and would not receive compensation.
An Australian version of these laws would mean that cyclists were more likely to be fairly compensated in the event of a crash. More importantly, such laws would encourage motorists to take extra care when driving alongside vulnerable road users. In many European nations presumed liability, which was originally introduced to reduce traffic crashes, is widely believed to be a key component of encouraging safer cycling.
A presumed liability law would encourage the full range of health, environmental and social benefits of cycling, and keep the spirit of Drais’s original Laufmaschine alive.
However, the law alone is not sufficient. Better cycling infrastructure, reduced speed limits in residential areas, and improved education for drivers and cyclists are all needed to keep our roads safe for everyone.
Soufiane Boufous is a member of the Australasian College of Road Safety Executive Committee, NSW Chapter.
The three-minute story of 800,000 years of climate change with a sting in the tail
 Ice cores are a window into the past hundreds of thousands of years. NASA Goddard Space Flight Center/Ludovic Brucker
There are those who say the climate has always changed, and that carbon dioxide levels have always fluctuated. That’s true. But it’s also true that since the industrial revolution, CO₂ levels in the atmosphere have climbed to levels that are unprecedented over hundreds of millennia.
So here’s a short video we made, to put recent climate change and carbon dioxide emissions into the context of the past 800,000 years.
The temperature-CO₂ connectionEarth has a natural greenhouse effect, and it is really important. Without it, the average temperature on the surface of the planet would be about -18℃ and human life would not exist. Carbon dioxide (CO₂) is one of the gases in our atmosphere that traps heat and makes the planet habitable.
We have known about the greenhouse effect for well over a century. About 150 years ago, a physicist called John Tyndall used laboratory experiments to demonstrate the greenhouse properties of CO₂ gas. Then, in the late 1800s, the Swedish chemist Svante Arrhenius first calculated the greenhouse effect of CO₂ in our atmosphere and linked it to past ice ages on our planet.
Modern scientists and engineers have explored these links in intricate detail in recent decades, by drilling into the ice sheets that cover Antarctica and Greenland. Thousands of years of snow have compressed into thick slabs of ice. The resulting ice cores can be more than 3km long and extend back a staggering 800,000 years.
Scientists use the chemistry of the water molecules in the ice layers to see how the temperature has varied through the millennia. These ice layers also trap tiny bubbles from the ancient atmosphere, allowing us to measure prehistoric CO₂ levels directly.
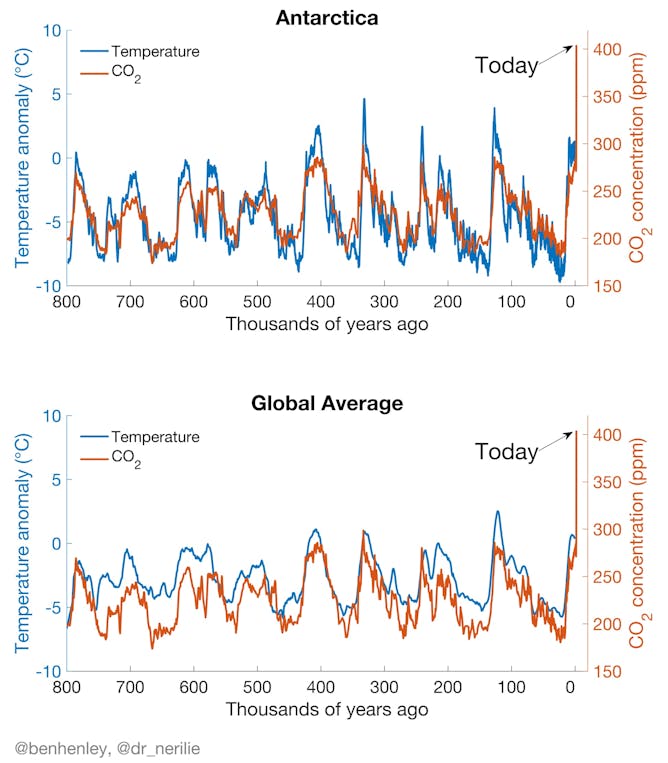 Antarctic temperature changes across the ice ages were very similar to globally-averaged temperatures, except that ice age temperature changes over Antarctica were roughly twice that of the global average. Scientists refer to this as polar amplification (data from Parrenin et al. 2013; Snyder et al. 2016; Bereiter et al. 2015).
Ben Henley and Nerilie Abram
Temperature and CO₂
Antarctic temperature changes across the ice ages were very similar to globally-averaged temperatures, except that ice age temperature changes over Antarctica were roughly twice that of the global average. Scientists refer to this as polar amplification (data from Parrenin et al. 2013; Snyder et al. 2016; Bereiter et al. 2015).
Ben Henley and Nerilie Abram
Temperature and CO₂
The ice cores reveal an incredibly tight connection between temperature and greenhouse gas levels through the ice age cycles, thus proving the concepts put forward by Arrhenius more than a century ago.
In previous warm periods, it was not a CO₂ spike that kickstarted the warming, but small and predictable wobbles in Earth’s rotation and orbit around the Sun. CO₂ played a big role as a natural amplifier of the small climate shifts initiated by these wobbles. As the planet began to cool, more CO₂ dissolved into the oceans, reducing the greenhouse effect and causing more cooling. Similarly, CO₂ was released from the oceans to the atmosphere when the planet warmed, driving further warming.
But things are very different this time around. Humans are responsible for adding huge quantities of extra CO₂ to the atmosphere – and fast.
The speed at which CO₂ is rising has no comparison in the recorded past. The fastest natural shifts out of ice ages saw CO₂ levels increase by around 35 parts per million (ppm) in 1,000 years. It might be hard to believe, but humans have emitted the equivalent amount in just the last 17 years.
 How fast are CO₂ levels rising?
Ben Henley and Nerilie Abram
How fast are CO₂ levels rising?
Ben Henley and Nerilie Abram
Before the industrial revolution, the natural level of atmospheric CO₂ during warm interglacials was around 280 ppm. The frigid ice ages, which caused kilometre-thick ice sheets to build up over much of North America and Eurasia, had CO₂ levels of around 180 ppm.
Burning fossil fuels, such as coal, oil and gas, takes ancient carbon that was locked within the Earth and puts it into the atmosphere as CO₂. Since the industrial revolution humans have burned an enormous amount of fossil fuel, causing atmospheric CO₂ and other greenhouse gases to skyrocket.
In mid-2017, atmospheric CO₂ now stands at 409 ppm. This is completely unprecedented in the past 800,000 years.
 Global Temperature and CO₂ since 1850.
Ben Henley and Nerilie Abram
Global Temperature and CO₂ since 1850.
Ben Henley and Nerilie Abram
The massive blast of CO₂ is causing the climate to warm rapidly. The last IPCC report concluded that by the end of this century we will get to more than 4℃ above pre-industrial levels (1850-99) if we continue on a high-emissions pathway.
If we work towards the goals of the Paris Agreement, by rapidly curbing our CO₂ emissions and developing new technologies to remove excess CO₂ from the atmosphere, then we stand a chance of limiting warming to around 2℃.
 Observed and projected global temperature on high (RCP8.5) and low (RCP2.6) CO₂ emission futures.
Ben Henley and Nerilie Abram
Observed and projected global temperature on high (RCP8.5) and low (RCP2.6) CO₂ emission futures.
Ben Henley and Nerilie Abram
The fundamental science is very well understood. The evidence that climate change is happening is abundant and clear. The difficult part is: what do we do next? More than ever, we need strong, cooperative and accountable leadership from politicians of all nations. Only then will we avoid the worst of climate change and adapt to the impacts we can’t halt.
The authors acknowledge the contributions of Wes Mountain (multimedia), Alicia Egan (editing) and Andrew King (model projection data).
Ben Henley receives funding from an ARC Linkage Project and is an associate investigator with the ARC Centre of Excellence for Climate System Science.
Nerilie Abram receives funding from the Australian Research Council.
Energy solutions but weak on climate – experts react to the Finkel Review
 The Finkel Review is scientifically modest but politically deft. Lukas Coch/AAP
 The keenly anticipated Finkel Review, commissioned in the wake of last year’s South Australian blackout, has made a range of recommendations aimed at delivering a reliable, secure and sustainable National Electricity Market.
Among the proposals is a new Clean Energy Target to boost investment in low-carbon electricity generation, as well as moves to require high-emitting power stations to give three years’ notice before shutting down.
Below, our experts react to the measures.
“Security and reliability are first”
Hugh Saddler, Honorary Associate Professor, Australian National University
With so much focus on the design of a mechanism to support a shift towards lower-emissions generation, it is easy to forget that the primary purpose of the Review, commissioned following the “system black” event in South Australia on September 28, 2016, was “to develop a national reform blueprint to maintain energy security and reliability”. It is thus appropriate that security and reliability are the first topics to be addressed in the main body of the report.
System security is defined as the ability of the system to tolerate disturbances. Maintaining security requires the system to be able to prevent very high rates of change of frequency. At present the system has no explicit mechanism for doing this, but relies implicitly on the inertia provided, effectively as a free service, by existing large thermal generators.
The report recommends a series of regulatory energy security obligations to provide this service by various additional means, falling on the transmission network service providers in each of the five NEM regions (states), and also on all new generators connecting to the system.
System reliability is defined as the ability of the system to meet consumer demand at all times. In the old system, this is achieved by “dispatchable” generators, meaning coal and gas generators that can vary their output as required to meet demand.
In the new system, with large amounts of variable wind and solar generation, other supply sources are needed to meet demand at times of low wind speed and/or lack of sun – that is, to act as complements to wind and solar. Existing hydro and open-cycle gas turbine generators are ideally suited to this task, but with the growth in wind and solar generation, this capacity will very soon be insufficient for the task across the NEM (and is already insufficient in SA).
The Report recommends what it calls a Generator Reliability Obligation, which would be triggered whenever the proportion of dispatchable generation (which could include batteries and other forms of storage) in a region is falling towards a predetermined minimum acceptable level. The obligation would fall on all new renewable generators wishing to connect thereafter and, in the words of the Report “would not need to be located on site, and could utilise economies of scale” through multiple renewable generation projects “pairing” with “one new large-scale battery of gas fired generation project for example”.
If implemented, this recommendation would seem certain to greatly complicate, slow down and add to the administrative overhead cost of building new renewable generation. It would involve putting together a consortium of multiple parties with potentially differing objectives and who would otherwise be competing with one another in the wholesale electricity market.
A far better approach would be to recognise that dispatchable generation provides a distinct and more valuable product than non-dispatchable generation. There should be a separate market mechanism, possibly based on a contracting approach, to provide this service. If well designed, this would automatically ensure that economies of scale, as may be realised by pumped hydro storage, for example, would be captured. This approach would be far more economically efficient, and thus less costly to electricity consumers, than the messy processes required under the Report’s obligation approach.
“Energy efficiency is effectively handballed to governments”
Alan Pears, Senior Industry Fellow, RMIT University
The Review’s approach to the demand side is very focused. Demand response, the capacity to reduce demand at times of extreme pressure on the supply system, is addressed thoroughly. The past under-utilisation of this approach is acknowledged, and the actions of the Australian Energy Market Operator (AEMO) intended to capture some of its potential in time for next summer are outlined.
However, the deep cultural problems within the Australian Energy Markets Commission regarding demand response are not tackled. Instead, the AEMC is asked (yet again) to develop facilitation mechanisms in the wholesale market by mid-2018.
Energy efficiency is effectively handballed to governments. After making some positive comments about its valuable roles, recommendation 6.10 states that governments “should accelerate the roll out of broader energy efficiency measures to complement the reforms recommended in this Review”.
This is a disappointing outcome, given the enormous untapped potential of energy markets to drive effective energy efficiency improvement. But it clearly shows governments that they have to drive energy-efficiency initiatives unless they instruct energy market participants to act.
“It follows the wrong path on greenhouse emissions”
David Karoly, Professor of Atmospheric Science, University of Melbourne and Member, Climate Change Authority
The Finkel Review says many sensible things about ways to improve the security and reliability of Australia’s electricity sector. However, it follows completely the wrong path in what it says about lower greenhouse emissions from the electricity sector and Australia’s commitments under the Paris Agreement. This is disappointing, as Alan Finkel is Australia’s Chief Scientist and a member of the Climate Change Authority.
All economy-wide modelling shows that the electricity sector must do a larger share of future emissions reductions than other sectors, because there are easier and cheaper solutions for reducing emissions in that sector. However, this review’s vision is for “emissions reduced by 28% below 2005 levels by 2030” – exactly the same as Australia’s target under the Paris Agreement. It should be much more.
Australia’s commitments under the Paris Agreement are “to undertake ambitious efforts” to limit global warming “to well below 2℃ above pre-industrial levels”. The Targets Report from the Climate Change Authority in 2015 showed that this means Australia and the electricity sector must aim for zero emissions before 2050, not in the second half of the century, as suggested in the Finkel Review.
Alan Pears has worked for government, business, industry associations public interest groups and at universities on energy efficiency, climate response and sustainability issues since the late 1970s. He is now an honorary Senior Industry Fellow at RMIT University and a consultant, as well as an adviser to a range of industry associations and public interest groups. His investments in managed funds include firms that benefit from growth in clean energy. He has shares in Hepburn Wind.
David Karoly receives funding from the Australian Research Council Centre of Excellence for Climate System Science and an ARC Linkage grant. He is a member of the Climate Change Authority and the Wentworth Group of Concerned Scientists.
Hugh Saddler does not work for, consult, own shares in or receive funding from any company or organization that would benefit from this article, and has disclosed no relevant affiliations beyond the academic appointment above.
The Finkel Review: finally, a sensible and solid footing for the electricity sector
Chief Scientist Alan Finkel’s long-awaited review of the National Electricity Market, released today, will make a significant difference to Australia’s electricity system in three key areas: reliability (making sure the system generates enough power to meet demand), security (making sure the system doesn’t break), and governance (making sure the electricity market can run effectively).
ReliabilityThe review recommends a Clean Energy Target (CET), which will provide subsidies to new low-emissions generation. The actual choice of scheme is less important than its durability. If broad political agreement can be reached on this target, it can provide the policy certainty that industry crucially needs to build new generation capacity and meet electricity demand.
Finkel also proposes a Generator Reliability Obligation, which places a limit on further wind and solar power in regions that already have a high proportion of intermittent generation. New intermittent generators will have to provide backup for some of their supply, in the form of new storage or contracts with new dispatchable generators such as gas. The aim is to ensure that federal and state subsidies for renewables do not push too much intermittent generation into the market without adequate backup.
Large generators will also need to provide a reasonable notice of closure – the review suggests a period of three years – before leaving the market. The aim here is to ensure the market has enough time to respond by installing new generation.
Finally, the review floats the possibility of further changes to ensure reliability, potentially a day-ahead market to lock in supply ahead of time, or a strategic reserve – a mechanism by which the market operator can sign contracts requiring generators to sit idle unless needed in an emergency.
The market operator (AEMO) can already do this, and the report is silent on how a strategic reserve would be different or whether it is definitely needed.
SecurityTo secure the electricity system, Finkel calls for existing standards to be tightened and new mechanisms to be introduced.
Transmission companies will be required to provide and maintain a prescribed level of inertia in the system – high levels of inertia can prevent rapid changes in frequency that harm the system. Fossil fuel generators may be required to change their settings to control the frequency in the system, whereas new generators, including renewables, will be required to provide fast frequency-response services to help avoid frequency fluctuations that can damage the grid.
While technical in their nature, these measures will reduce the likelihood of instability in the system and provide extra tools to fix the it if instability arises.
Finkel also makes recommendations to bolster the emergency management plan for the 2017-18 summer and to encourage consumers – both residential and business – to reduce their demand at peak times. The review strongly encourages the development of “demand response” schemes to give consumers incentives to switch off and help smooth the load at peak times.
GovernanceThe biggest change to how the market will be run is the proposed creation of an Energy Security Board (ESB). The ESB will comprise an independent chair and vice-chair, as well as the heads of the three governing bodies: the AEMC, AEMO and the market regulator (the AER). At a minimum, the ESB will be responsible for implementing many of the Finkel Review recommendations, although the panel leaves scope for it to do much more.
Finkel recommends a comprehensive review of the rules governing the electricity market. It also argues for increased accountability for market bodies and the COAG Energy Council, through enhanced performance indicators and a beefed-up process for determining and monitoring priorities for the energy sector.
What happens next?The report makes a range of other recommendations designed to ensure better service for energy consumers, more transparency in gas markets, and improved planning and coordination of electricity networks.
The Finkel Review successfully addresses the main issues confronting the electricity sector today. At the very least, it is a step towards a more reliable and secure system.
The devil, as always, will be in the detail. Much will depend on how the recommendations are implemented. Australian households and business can only hope that the new Energy Security Board and the nation’s political leaders will see this through.
David Blowers does not work for, consult, own shares in or receive funding from any company or organization that would benefit from this article, and has disclosed no relevant affiliations beyond the academic appointment above.
The Finkel Review at a glance
The long-awaited report from Chief Scientist Alan Finkel into Australia’s National Electricity Market was released today.
The key recommendation is the adoption of a Clean Energy Target. This mandates that energy retailers provide a certain amount of their electricity from “low-emissions” generators – sources that produce emissions below a threshold level of carbon dioxide per megawatt.
Crucially, Dr Finkel has not made a recommendation as to the precise threshold or the number of certificates to be issued, saying:
The Panel acknowledges that the specific emissions reduction trajectory that should be set for the electricity sector is a question for governments.
At a minimum, the electricity sector should have a trajectory consistent with a direct application of the national target of 26-28% reduction on 2005 levels by 2030, as per Australia’s international obligations under the Paris Agreement.
 Independent Review into the Future Security of the National Electricity Market/The Conversation, CC BY-ND
Three charts on: Australia's declining taste for beef and growing appetite for chicken
 Australian consumption of chicken and pork both now far outstrip beef, mutton and lamb. Ben Phillips/Flickr, CC BY
Australians were once world champion beef-eaters but now you’re much more likely to find chicken than steak on Australian dinner tables.
Total meat consumption per capita in Australia has been stable since the 1960s, at around 110 kilograms per person per year. But the type of meat consumed has changed significantly, with chicken and pork both now far outstripping beef, mutton and lamb, according to historical data from researchers Wong et al and more recent data from the Australian Bureau of Agricultural and Resource Economics and Sciences (ABARES).
(The apparent spike in beef consumption in the late 1970s is linked to Australia’s beef export trade crash and much of this spike was thought to have gone to pet food and by-products rather than the dinner table).
Whereas chicken was once a rare meal, eaten on special occasions, today the Australian chicken industry produces around 600 million chickens a year. Most are consumed domestically.
The per-capita annual consumption of chicken meat in Australia increased ten-fold from 4.6 kilograms per person in 1965 to 47 kilograms in 2016. The industry projects growth to 49.2 kilograms a person by 2019–20.
From the 1960s on, public health messages steered people away from red meats. There was also a rapid proliferation of fast food franchises selling chicken - notably the entry of Kentucky Fried Chicken in 1969.
Similarly, pork consumption has been bolstered by re-marketing. Once considered a red meat, pork was reinvented as “the other white meat” through a marketing campaign categorising pork as lighter and healthier, alongside chicken (and due to changes in breeding, pork meat really has lightened in colour over recent decades). While not as steep an increase as chicken, pork consumption in Australia has nearly tripled since the 1980s.
However, a major driver of these changes has been price, linked to massive changes in production.
After adjusting for inflation, chicken per kilo costs less than a third of its price than it did in the early 1970s, while real prices for other meats have been comparatively static. The Australian Chicken Meat Federation, which represents chicken producers, reports that over the five years to 2014–15, chicken meat was on average 50% cheaper than pork, 59% cheaper than lamb and 65% cheaper than beef.
Since the 1960s, most Australian chicken and pork production has become rapidly industrialised and automated in large intensive indoors operations. Piggeries and broiler farms have typically become specialised, intensified, high technology factory farm complexes. Intensification of chicken production has increased efficiency, in turn steadily decreasing the retail price of chicken. Around 70% of chicken meat is supplied by two privately owned processing companies, the Australian Chicken Meat Federation says.
Chicken farms in Australia have increased markedly in size and intensity. Our research on planning disputes shows farms of the 1970s housed around 10,000 chickens. Now, while nearly 600 million broiler chickens were slaughtered in Australia in 2014-15, there were only around 750 broiler farms, a decline from the 1990s. The average chicken farm now has nearly 120,000 chickens at any one time and some run into millions. The number of pork farms has also dropped, consolidating into larger operations.
Global meat consumption continues to rise rapidly as more countries – notably China – increase their consumption of meat and dairy products. Australia imports very little meat due to strict quarantine, but is a major exporter of beef, sheep and goats.
Sheep and cattle farms are more extensive, more common, and produce fewer animals than pork or chicken farms. There were over 66,000 cattle farms and around 39,000 sheep farms in Australia in 2015-16. Cattle farm numbers and the overall cattle herd declined slightly, although this belies the formation of two extremes: at one end large and export-focussed grazing, while other areas have seen a proliferation of sub-commercial, small-scale, scattered “hobby” grazing. The national sheep flock also declined, and is transitioning away from wool production to meat and dual-purpose breeds.
These transitions in production and consumption of meat result in some rural and semi-rural landscapes shifting to expansive, remotely-managed holdings in areas with declining population. Closer to cities, hobby farmers and amenity migrants sit in often uneasy proximity to industrial scale production.
As other countries take up Australia’s traditional fondness for meat, global as well as domestic forces continue to change the nature of farming and Australian rural landscapes. That, in turn, also affects the price and type of meat Australians consume.
The authors do not work for, consult, own shares in or receive funding from any company or organisation that would benefit from this article, and have disclosed no relevant affiliations beyond the academic appointment above.
Australia has stalled on car efficiency
 Australia is falling far behind other countries in improving car pollution. , CSIRO/Wikimedia commons, CC BY-SA
Last year, Australia’s new cars were just 1.1% less polluting than the year before, according to a report released this week by the National Transport Commission.
This is the smallest improvement on record, and largely due to our growing preference for SUVs and utes. In addition, some locally manufactured cars actually became less efficient.
But the backdrop of this poor performance is Australia’s astonishing lack of mandatory vehicle efficiency standards (adopted by 80% of the world), which allows foreign manufacturers to offload their least efficient cars in Australia.
 In the absence of strong regulation, vehicle emission reduction has plateaued.
‘Improving the efficiency of new light vehicles’, Commonwealth of Australia 2016, CC BY
In the absence of strong regulation, vehicle emission reduction has plateaued.
‘Improving the efficiency of new light vehicles’, Commonwealth of Australia 2016, CC BY
These findings vindicate a 2016 report from the Bureau of Infrastructure, Transport and Regional Economics, which advised that in the absence of policy changes, the rate of emissions improvement could return to around 1%. The report also warned that Australia would be increasingly left behind by other countries.
Both predictions have come true. The NTC report shows the average emissions intensity for new passenger vehicles sold in Australian was 46% higher than their European Union counterparts.
This gap jumps to 80% for locally manufactured cars. Our local vehicle efficiency has not improved since 2012 and actually went backwards between 2015 and 2016. The difference is largely attributable to a 5.8% increase in Holden’s average emission intensity in 2016.
We’re buying more polluting carsThe NTC report found that consumer preferences play a large role in the slowing rate of vehicle efficiency improvements. Australians bought more SUVs and utes, but far fewer “green cars” (vehicles that emit less than 120g of carbon dioxide per kilometre).
 Green car sales have fallen dramatically.
Carbon Dioxide Emissions Intensity for New Australian Light Vehicles 2016, National Transport Australia
Green car sales have fallen dramatically.
Carbon Dioxide Emissions Intensity for New Australian Light Vehicles 2016, National Transport Australia
The proportion of green cars sold in 2016 fell to 2.5% of total car sales, from 4.7% in 2015. Lower consumer demand has reduced the number of green car models available, from 72 green car models in 2015 to 51 green car models in 2016.
Finally, total sales of electric vehicles dropped 80% in 2016 (219 sales) compared to 2015 (1,108 sales)
Strong government actionThe cheapest way for Australia to reduce our greenhouse gas emissions is to introduce mandatory fuel efficiency standards. Without them, global manufacturers have no incentive to offer more efficient models, and a 2016 government report into fuel efficiency found that:
The best-performing variants sold in Australia were about 27% worse on average than the most efficient model variants offered in the UK.
The same report investigated the costs and benefits of three different options for efficiency regulations, which could be phased in between 2020 and 2025.
 The cost and benefits of three proposed emissions targets for new light vehicles.
‘Improving the efficiency of new light vehicles’, Commonwealth of Australia 2016, CC BY
The cost and benefits of three proposed emissions targets for new light vehicles.
‘Improving the efficiency of new light vehicles’, Commonwealth of Australia 2016, CC BY
 Target A, the most strict fuel efficiency option being considered by the government, would deliver 6% of Australia’s 2030 emission reduction target.
‘Improving the efficiency of new light vehicles’, Commonwealth of Australia 2016
Target A, the most strict fuel efficiency option being considered by the government, would deliver 6% of Australia’s 2030 emission reduction target.
‘Improving the efficiency of new light vehicles’, Commonwealth of Australia 2016
All three options provide a net financial benefit, with the most stringent regulation saving the most money (primarily though reducing the cost of fuel, but also by helping stay within our carbon budget).
Adopting target A, which proposes all new cars release a maximum of 105g of CO₂ per kilometre by 2025, will prompt car manufacturers to import the most efficient vehicles available. The price increase in cars would be recouped by dramatically lower fuel costs, as shown in the table below.
It will also deliver 6% of Australia’s 2030 emissions-reduction target.
 At a retail fuel price of $1.30 per litre, an average motorist (as defined by the 2014 census) could recoup additional purchase costs for an average performing passenger vehicle within four years.
‘Improving the efficiency of new light vehicles’, Commonwealth of Australia 2016, CC BY
At a retail fuel price of $1.30 per litre, an average motorist (as defined by the 2014 census) could recoup additional purchase costs for an average performing passenger vehicle within four years.
‘Improving the efficiency of new light vehicles’, Commonwealth of Australia 2016, CC BY
However the dire state of Australia’s road emissions makes a strong case for introducing new efficiency standards before 2020. Light vehicles currently account for 10% of Australia’s annual greenhouse gas emissions, about 57 million tonnes.
On the other hand, the NTC report found that if all new vehicles bought in 2016 in Australia had been the most efficient in their class, emissions would have been reduced by 59%.
Until we have firm fuel efficiency standards that create a consumer incentive towards low-emission vehicles and prevent global manufacturers from offloading highly polluting models in Australia, we’ll fail to make real progress in reducing road emissions.
Anna Mortimore does not work for, consult, own shares in or receive funding from any company or organisation that would benefit from this article, and has disclosed no relevant affiliations beyond the academic appointment above.
Explainer: what is a 'low emissions target' and how would it work?
The main job of the Finkel Review, to be released this week, is to set out ways to reform the National Electricity Market (NEM) to ensure it delivers reliable and affordable power in the transition to low-carbon energy. Yet most of the attention has been focused on what type of carbon-reduction scheme Australia’s chief scientist, Alan Finkel, will recommend.
The expectation is that he will advocate a “low emissions target” (LET), and it looks like industry is getting behind this.
That would be instead of an emissions intensity scheme (EIS), which had been supported by much of industry as well as regulators and analysts, but the government rejected this.
Both types of scheme are second-best approaches to a carbon price. They can have similar effects depending on their design and implementation, although an EIS would probably be more robust overall.
How a LET might workA LET would give certificates to generators of each unit of electricity below a threshold carbon intensity. Electricity retailers and industry would be obliged to buy the certificates, creating a market price and extra revenue for low-emission power generators.
How many certificates get allocated to what type of power generator is an important design choice. Government would also determine the demand for the certificates, and this defines the overall ambition of the scheme.
At its core, the scheme would work rather like the existing Renewable Energy Target, which it would replace. But the new scheme would also include some rewards for gas-fired generators, and perhaps even for coal-fired generators that are not quite as polluting as others. The question is how to do this.
A simple but crude way of implementing a LET would be to give the same number of certificates for every megawatt hour (MWh) of electricity generated using technologies below a benchmark level of emissions intensity. In practice, that would be renewables and gas. In principle, the scheme could include nuclear power as well as coal plants with carbon capture and storage, but neither exists in Australia, nor are they likely to be built.
Such a simple implementation would have two drawbacks. One, it would create a strong threshold effect: if your plant is slightly above the benchmark, you’re out, slightly below and you’re in. Two, it would give the same reward to gas-fired generators as to renewables, which is inefficient from the point of view of emissions reduction.
A better way is to scale the amount of certificates issued to the emissions intensity of each plant.
If the benchmark was 0.7 tonnes of carbon dioxide per MWh of electricity (as some media reports have predicted), then a gas plant producing 0.5 tonnes of CO₂ per MWh would get 0.2 certificates per MWh generated. A wind or solar farm, with zero emissions, would receive 0.7 certificates per MWh generated.
The benchmark could also be set at a higher level, potentially so high that all power stations get certificates in proportion to how far below the benchmark they are. For example, a benchmark of 1.4 tonnes CO₂ per MWh would give 1.4 certificates to renewables, 0.9 certificates to the gas plant, 0.5 certificates to an average black coal plant and 0.2 certificates to a typical brown coal plant.
Including existing coal plants in the LET in this way would create an incentive for the sector to move towards less polluting generators. It would thus help to reduce emissions from the coal fleet, and perhaps pave the way for the most polluting plants to be retired earlier. But the optics would not be good, as the “low emissions” mechanism would be giving credits to coal.
Whichever way certificates are distributed, the government also has to specify how many certificates electricity retailers need to buy. Together with the benchmark and with how electricity demand turns out, this will determine the emissions intensity of overall power supply. The benchmark would need to decline over time; alternatively, the amount of certificates to be bought could be increased.
The price of LET certificates would depend on all of these parameters, together with the cost of energy technologies, and industry expectations about the future levels of all of these variables. As the experience of the RET has shown, these can be difficult to predict.
Low emissions target vs emissions intensity schemeAn emissions intensity scheme (EIS) is the proposal that in recent times had the broadest support in the policy debate. Finkel’s preliminary report referenced it and the Climate Change Authority earlier put significant emphasis on it. But it got caught in the internal politics of the Liberal-National Coalition and was ruled out.
Under an EIS, the government would set a benchmark emissions intensity, declining over time. Generators below the benchmark would be issued credits, whereas those running above the benchmark would need to buy credits to cover their excess emissions. Supply and demand set the price in this market.
Depending on how the parameters are set, the effects of a LET and an EIS on the power mix and on power prices would differ, but not necessarily in fundamental ways.
There are some key differences though. Under a LET, electricity retailers will need to buy certificates and not all power plants may be covered by a low-carbon incentive. Under an EIS, the higher-polluting plants buy credits from the cleaner ones, and all types of plants are automatically covered. The EIS market would be closely related to the wholesale electricity market, with the same participants, whereas a LET market would be separate and distinct, like the RET market now.
Further, the benchmark in an EIS directly defines the emissions intensity of the grid and its change over time. Not so for the benchmark in a LET. A LET will also require assumptions about future electricity demand in setting the total amount of credits that should be purchased – and bear in mind that the estimates used to calibrate the RET were wildly off the mark.
What’s more, an EIS might present a chance to circumvent the various special rules and exemptions that exist in the RET, and which might be carried over to the LET.
Politics vs economicsNeither a LET nor an EIS provides revenue to government. Since the demise of Australia’s previous carbon price this has often been considered desirable politically, as it avoids the connotations of “carbon tax”. But economically and fiscally it is a missed opportunity.
Globally, most emissions trading schemes generate revenue that can be used to cut other taxes, help low-income households, or pay for clean energy research and infrastructure.
An economically efficient system should make carbon-based electricity more expensive, which encourages energy consumers to invest in energy-saving technology. Both a LET and an EIS purposefully minimise this effect, and thus miss out on a key factor: energy efficiency.
Ambition and confidenceMore important than the choice of mechanism is the level of ambition and the political durability of the policy.
Bringing emissions into line with the Paris climate goals will require fundamental restructuring of Australia’s power supply. Coal would need to be replaced well before the end of the lifetime of the current plants, probably mostly with renewables.
To prompt large-scale investment in low-carbon electricity, we need a reliable policy framework with a genuine and lasting objective to reduce emissions. And investors need confidence that the NEM will be governed by rules that facilitate this transition.
Of any policy mechanism, investors will ask the hard questions: what will be its actual ambition and effects? Would the scheme survive a change in prime minister or government? Would it stand up to industry lobbying? Investor confidence requires a level of predictability of policy.
If a LET were supported by the government and acceptable to the Coalition backbench, and if the Labor opposition could see it as a building block of its climate policy platform, then the LET might be a workable second best, even if there are better options. Over the longer term, it could be rolled into a more comprehensive and efficient climate policy framework.
Frank Jotzo has received research funding from various organisations including the ARC and Australian government.
What is a pre-industrial climate and why does it matter?
Over the past few days there has been a lot of talk about the Paris climate agreement, from which the United States is planning to withdraw. Although this is a setback, there is still near-complete consensus from the world’s governments that a strong effort to tackle climate change is needed.
The Paris Agreement aims to limit global warming relative to a pre-industrial baseline. Its precise commitment is:
Holding the increase in the global average temperature to well below 2℃ above pre-industrial levels and to pursue efforts to limit the temperature increase to 1.5℃ above pre-industrial levels, recognising that this would significantly reduce the risks and impacts of climate change.
But this begs the question: what are “pre-industrial levels”?
Clearly, if we’re aiming to limit global warming to 1.5℃ or 2℃ above a certain point, we need a common understanding of what we’re working from. But the Paris Agreement doesn’t provide a definition.
This becomes key as governments expect climate scientists to coherently compare different plans to reach their Paris targets. It’s crucial to be clear on what researchers mean when we say “pre-industrial”, and what assumptions our projections are based on.
Of course, as the chart below shows, no matter which baseline we use it’s clear there’s been a drastic rise in global temperature over the last century.
 Global temperatures are on the rise and are about 1℃ above late 19th century levels.
Author provided
Defining a pre-industrial baseline
Global temperatures are on the rise and are about 1℃ above late 19th century levels.
Author provided
Defining a pre-industrial baseline
The Industrial Revolution began in the late 1700s in Britain, and spread around the world. But this only marked the beginning of a gradual rise in our greenhouse gas emissions. Various studies have found climate change signals appearing on a global scale as early as the 1830s, or as recently as the 1930s.
Besides the evolving and increasing human influence on the climate, we also know that plenty of other natural factors can affect Earth’s temperature. This natural variability in the climate makes it harder to determine a single precise pre-industrial baseline.
Scientists separate these natural influences on the climate into two groups: internal and external forcings.
Internal forcings transfer heat between different parts of Earth’s climate system. The El Niño-Southern Oscillation, for example, moves heat between the atmosphere and the ocean, causing year-to-year variations in global average surface temperatures of about 0.2℃. Similar variations also happen on decadal timescales, which are associated with slower energy transfers and longer variations in Earth’s temperature.
External forcings come from outside Earth’s climate system to influence global temperature. One example of an external forcing is volcanic eruptions, which send particles into the upper atmosphere. This prevents energy from the Sun reaching Earth’s surface, and leads to a temporary cooling.
Another external influence on Earth’s climate is the variability in the amount of energy the Sun emits.
The Sun’s total energy output varies on multiple cycles and is related to the number of sunspots, with slightly higher temperatures when there are more sunspots, and vice versa.
Earth has experienced extended periods of cooling due to more frequent explosive volcanic eruptions and periods of few sunspots – such as during the “Little Ice Age” which lasted roughly from 1300 to the 1800s.
 There is high variability in the solar and volcanic influences on the climate (top row) while greenhouse gas influences rise over time (bottom row). A suggested 1720-1800 baseline is highlighted in grey.
Adapted from Hawkins et al. (2017).
There is high variability in the solar and volcanic influences on the climate (top row) while greenhouse gas influences rise over time (bottom row). A suggested 1720-1800 baseline is highlighted in grey.
Adapted from Hawkins et al. (2017).
All of these factors mean that Earth’s climate can vary quite substantially even without human interference.
It also means that if we choose a pre-industrial baseline when there was low solar activity, like the late 1600s, or in a period of high volcanic activity, like the 1810s or the 1880s, then we would have a lower reference point and we would pass through 1.5℃ or 2℃ sooner.
A challenge not only for scientistsAt the moment there is a drive among the climate science community to better understand the impacts of 1.5℃ of global warming. The Intergovernmental Panel on Climate Change will deliver a special report on 1.5℃ next year.
But scientists are defining “pre-industrial” or “natural” climate in different ways. Some work from the beginning of global temperature records in the late 19th century, while others use climate model simulations that exclude human influences over a more recent period. One recent study suggested that the best baseline might be 1720-1800.
These different definitions make it harder to synthesise the results from individual studies, which is vital to informing decision-making.
This will have to be a consideration in the writing of the IPCC’s report, as policymakers will need to easily compare impacts at different levels of global warming.
There is no definitive way to determine the best “pre-industrial” reference point. An alternative might be to avoid the pre-industrial baseline altogether, and instead set targets from more recent periods, when we have a better grasp of what the global climate looked like.
You can read more about defining a pre-industrial climate here and here.
Andrew King receives funding from the ARC Centre of Excellence for Climate System Science.
Ben Henley receives funding from an ARC Linkage Project and is an associate investigator with the ARC Centre of Excellence for Climate System Science.
Ed Hawkins receives funding from the UK's Natural Environment Research Council and National Centre for Atmospheric Science.
While nations play politics, cities and states are taking up the climate challenge
Last week, Donald Trump entered the White House Rose Garden and announced that the United States would withdraw from the Paris climate accord. In doing so, he fulfilled his campaign promise to “cancel” the Paris deal, a move that calls into question the future of the entire agreement.
In withdrawing, Trump cited the (arguably short-term) sacrifice the agreement requires of the US. This perspective fulfils the famous prediction made by economist Garrett Hardin in the 1960s: the “tragedy of the commons”. Hardin wrote that self-interest drives individuals to exploit collective resources in the short term, even to their long-term detriment.
Hardin and those following him thought the only way to avoid this tragedy was by securing collective agreements. That is why so many people view the Paris Accord as a vital mechanism for addressing climate change. It is also why the US withdrawal is devastating.
But another famous economist, Elinor Ostrom, saw things differently. Writing after the demise of the Kyoto Agreement but before the Paris Accord, Ostrom said that faith in multinational accords to address climate change was misplaced. Ostrom saw the limits of such collective action. Crucially, Ostrom suggested that we should also recognise the potential of localised collective action.
And already there are examples in both the developed and developing world that this is happening right now.
The new global leadershipUltimately, efforts to reduce global warming are advanced by the pedestrian, daily choices of households, businesses, and sub-national governments. Millions of local choices can have global effects, for good or ill.
It’s clear that Trump is stepping away from global leadership on climate change. But in response, the state governors of Washington, New York and California declared they remain committed to the Paris climate targets. Since then, a further 10 US states have joined the budding Climate Alliance.
In the past two decades, mounting evidence has shown the power of such efforts to reduce emissions of greenhouse gases. These efforts have been driven by policy entrepreneurs – people with vision, energy, and the collaborative instincts required to promote collective action. A classic example is provided by the former mayor of London, Ken Livingstone, who in 2005 invited mayors from other mega-cities to join him in promoting climate change efforts. That initiative has spurred many more, with transformative effects.
Looking around the world, we can see the diversity of localised initiatives in place to address climate change.
In Sao Paulo, Brazil, traffic congestion and pollution are being addressed by providing better public transport options and more bicycle lanes.
In Ethiopia, the Addis Ababa Light Rail Transport Project aims to reduce significantly the greenhouse gas emissions from cars.
In India, Kolkata has implemented the Solid Waste Management Improvement Project, which is reducing the release of methane emissions, while contributing to improved public sanitation.
Across Europe, cities have started emulating meat-free Thursdays, which originated in Ghent, Belgium. Aside from other benefits, reducing meat consumption can reduce agricultural greenhouse gas emissions.
In the US, leaders in cities and states have done much to reduce greenhouse gas emissions caused by cars and coal-fired power plants, for example through the Regional Greenhouse Gas Initiative.
Globally, the Carbon Disclosure Project has significantly influenced actions of businesses and governments alike.
Particularly important for smaller developing countries is the Cartegena Dialogue. It creates opportunities for leaders to share strategies for mitigating climate change and – just as urgently, especially for small Pacific nations – adapting to it.
The Paris Accord is a landmark, multilateral initiative. The withdrawal of the US is appalling, and deserves a strong rebuke. But it does not foreshadow the unravelling of multilateral resolve for addressing climate change.
The backslappers in Washington have had their Rose Garden moment. Elsewhere, energetic policy entrepreneurs are mobilising. Grounded in their communities, they are acting to protect the planet for today’s young people, and for those not yet born. That too, is global leadership.
Michael Mintrom does not work for, consult, own shares in or receive funding from any company or organisation that would benefit from this article, and has disclosed no relevant affiliations beyond the academic appointment above.
Curious Kids: Do sharks sneeze?
 A shark's nose is chemosensory only, and it doesn’t join up to the back of the throat like ours does. Flickr/Leszek Leszczynski, CC BY-SA
This is an article from Curious Kids, a new series for children. The Conversation is asking kids to send in questions they’d like an expert to answer. All questions are welcome – serious, weird or wacky!
Do sharks sneeze? – Desmond, aged 4, Perth.
When an animal sneezes, it’s their way of getting rid of annoying bits and pieces that have floated inside their nose and mouth.
While many animals, including humans, elephants, pandas and even seals, can sneeze, sharks unfortunately cannot. To be able to sneeze, an animal needs to move air (or water) from the lungs through its nose to the outside.
Sharks have two nostrils (called nares) below their snout that are used for smelling, but they don’t join up to the back of the throat like our nose does, so they can’t sneeze like we do. If something floats into their nares, they might try to shake it out.
 Shark nostrils are called nares, but they do their breathing through their gills at the back of the mouth.
Flickr/Lwp Kommunikáció, CC BY
Shark nostrils are called nares, but they do their breathing through their gills at the back of the mouth.
Flickr/Lwp Kommunikáció, CC BY
Sharks breathe through the gills at the back of the mouth. Most of their “smelling” is done using a process called chemoreception, which allows sharks to sense tiny pieces of stuff, called molecules, hiding in the water as they pass through their nares.
Sharks can find and recognise these molecules – like parts of blood – that have been released from wounded animals or other prey, because their sense of smell is much better than ours.
Nares are loaded with powerful sensors. Once a shark has locked onto a smell, it can then work out where it came from by swimming towards it and moving its head slightly from side to side. It’s a bit like us following the smell of a freshly baked cake.
 It’s an exaggeration to say a shark can smell a single drop of blood in the ocean. But they might be able to smell tiny drops of blood in the water from up to five kilometres away.
Flickr/Elias Levy, CC BY
It’s an exaggeration to say a shark can smell a single drop of blood in the ocean. But they might be able to smell tiny drops of blood in the water from up to five kilometres away.
Flickr/Elias Levy, CC BY
Legend has it that sharks can smell a single drop of blood in the ocean, but that’s an exaggeration. What they can do is detect blood at one part per million, which is similar to detecting tiny drops of blood in the water from up to five kilometres away!
While some have claimed to capture sightings of sharks sneezing on video, it just isn’t physically possible.
You might think this shark is sneezing, but trust me – it’s not.The movement people confuse with sneezing is likely the animal’s attempt at getting rid of unwanted objects from their mouth or stomach area.
Sharks can actually make their stomach stick out of their mouth for brief moments to get rid of things they have eaten that they don’t like, such as tyres, licence plates, fish bones and fish hooks. This is called gastric eversion and it’s a very cool trick.
Gastric eversion is where a shark or other animal empties its stomach by making it stick out of their mouth.Alternatively, a shark stretching its jaws, which they sometimes do after a meal, might be mistaken for a sneeze.
While sharks can’t sneeze like we do, they can smell and they have other great ways of getting rid of unwanted things from inside them.
Hello, curious kids! Have you got a question you’d like an expert to answer? Ask an adult to send your question to us. They can:
* Email your question to curiouskids@theconversation.edu.au
* Tell us on Twitter by tagging @ConversationEDU with the hashtag #curiouskids, or
* Tell us on Facebook
 CC BY-ND
Please tell us your name, age, and which city you live in. You can send an audio recording of your question too, if you want. Send as many questions as you like! We won’t be able to answer every question but we will do our best.
Jane Williamson does not work for, consult, own shares in or receive funding from any company or organisation that would benefit from this article, and has disclosed no relevant affiliations beyond the academic appointment above.